Section 8 ENRICHMENT ANALYSER (REGIONS) - EAR
8.1 Input Interface
Input
Step 1andStep 2: Enter a list of genomic regions. Please ensure that input genomic coordinates (Step 2) are consistent with the genome build (Step 1).Step 3: Use genomic proximity, quantitative trait locus mapping, or promoter capture Hi-C to identify linked genes.Step 4: Select from a list of supported ontologies.More Controls: Use additional parameters to fine-tune the steps described above.SUBMIT: click the SUBMIT button to execute the analysis.
Output
- Example Output includes interactive tables and high-quality figures for enrichment results. A summary of input data and the runtime (computed on the server side) is also provided for reference.
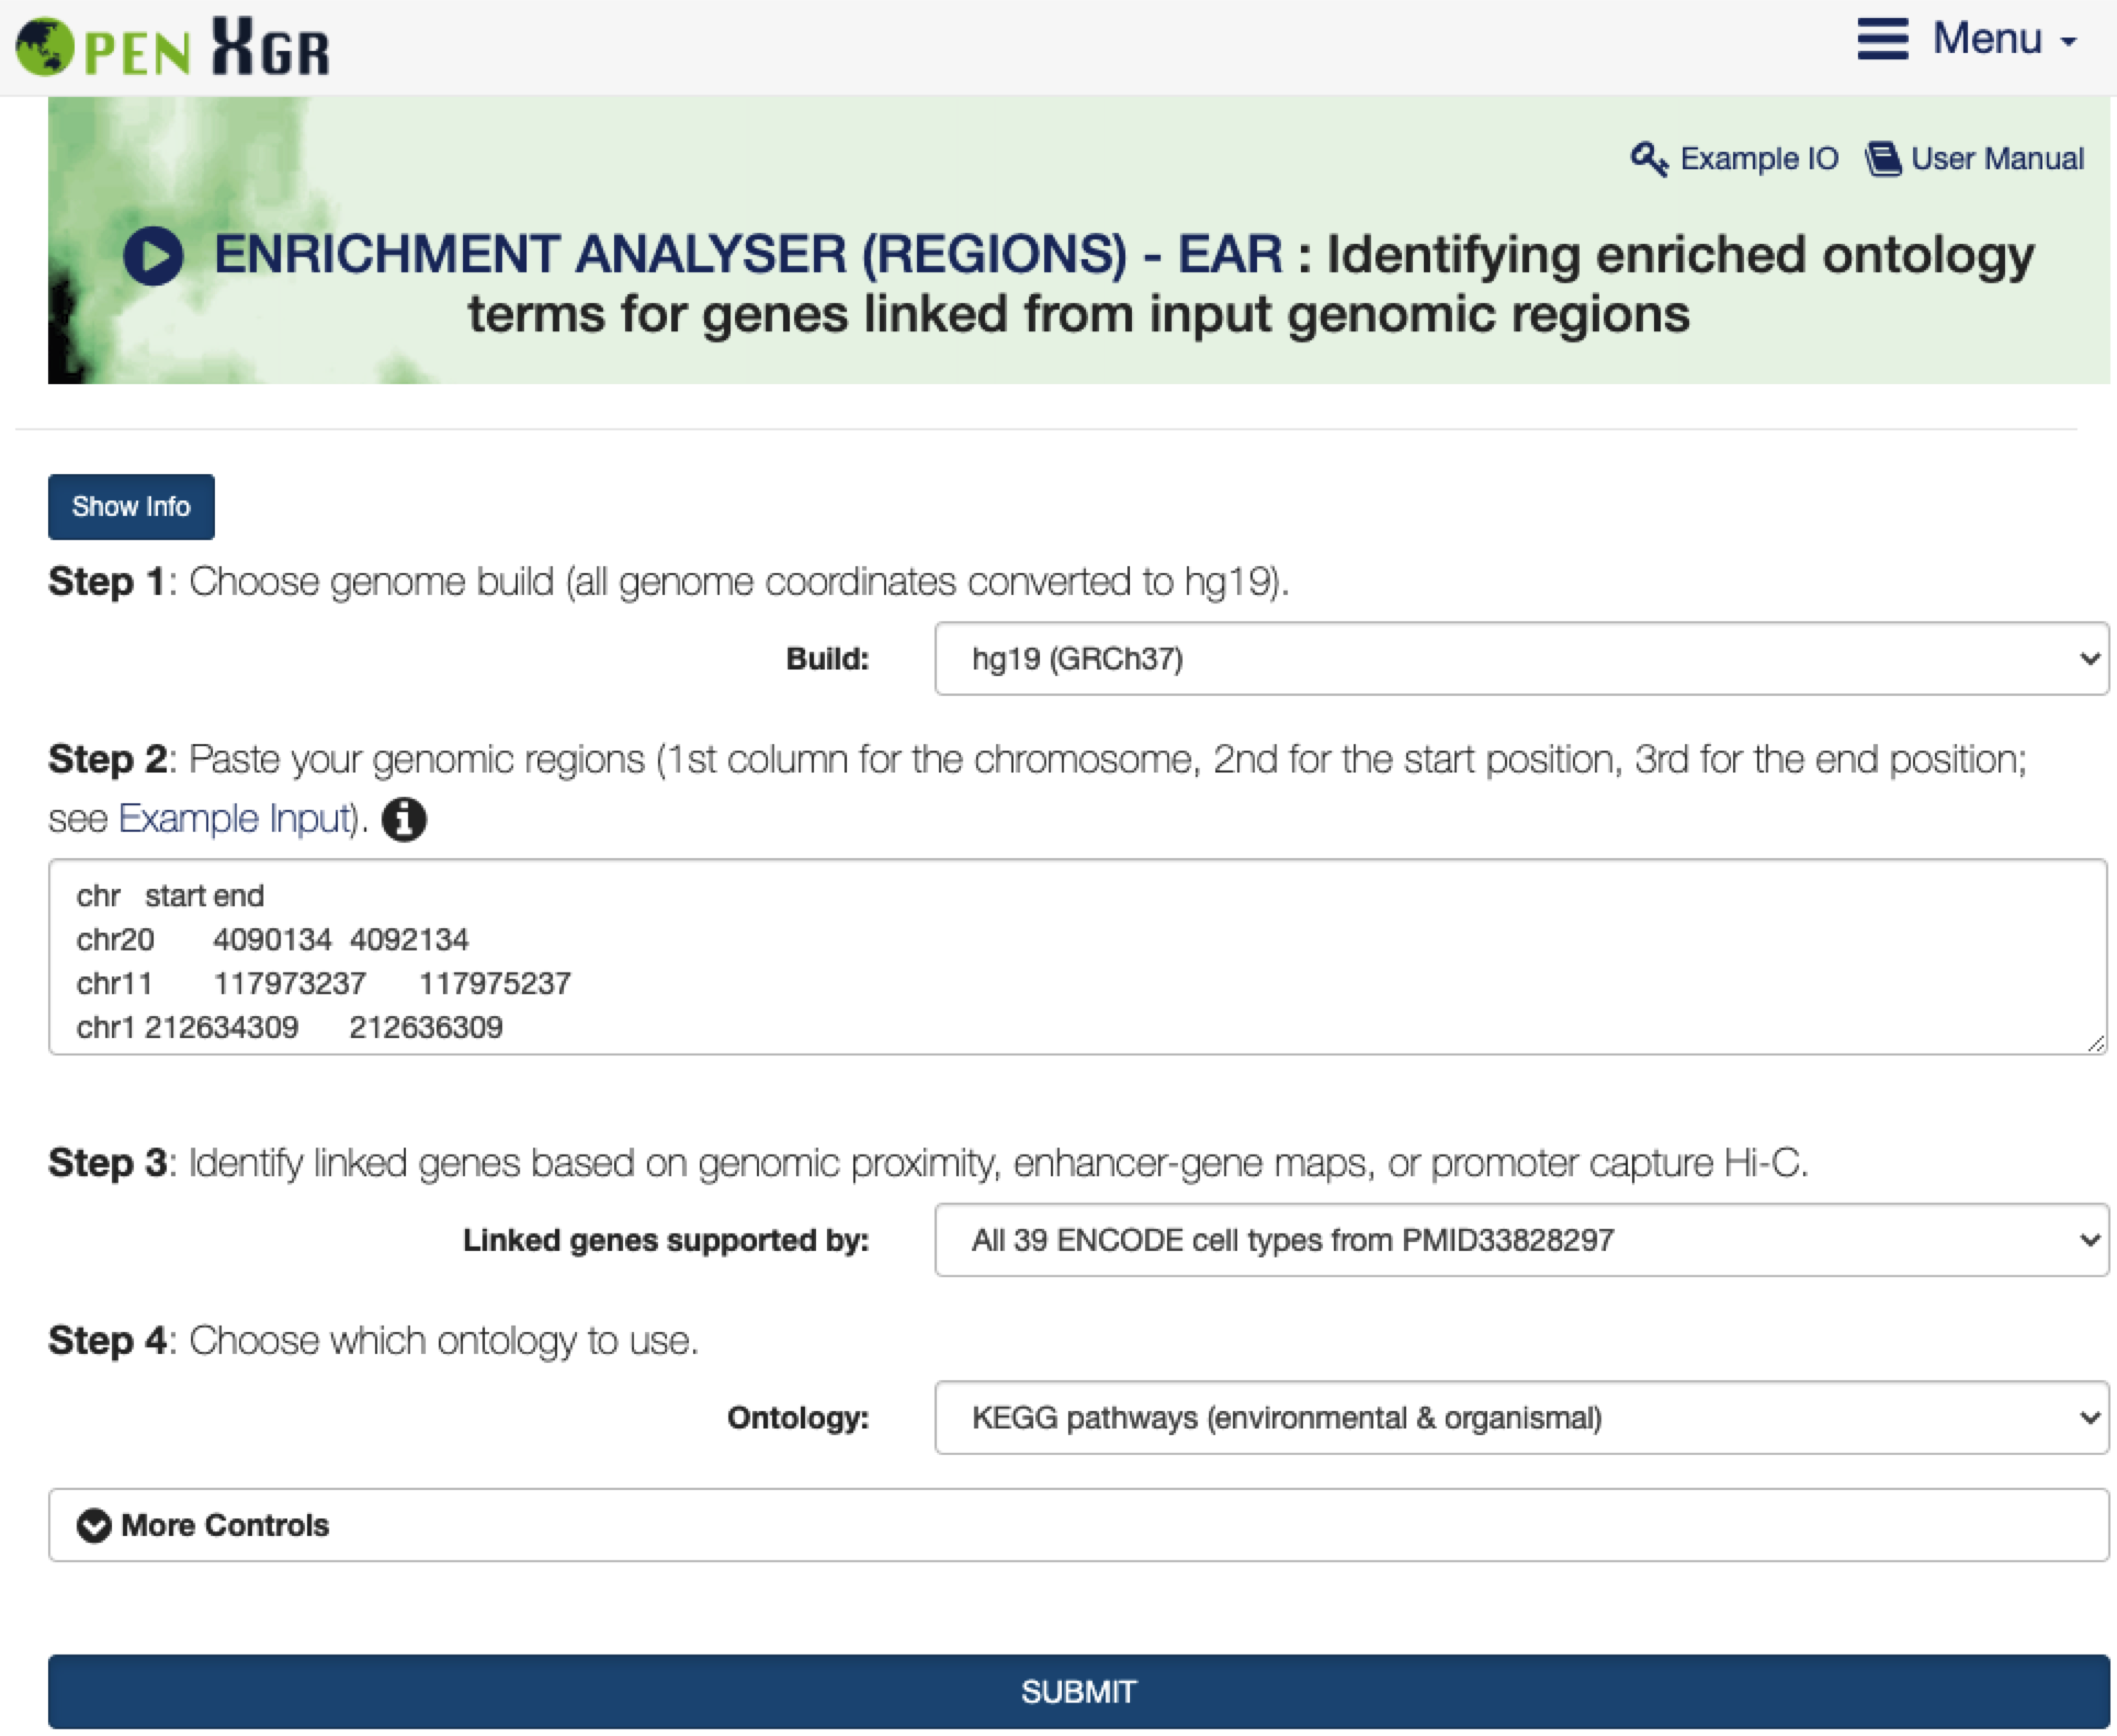
FIGURE 8.1: The interface of ENRICHMENT ANALYSER (REGIONS) - EAR. The Show/Hide Info toggle button contains the instructions on how to use it, including inputs, outputs, and other relevant information.
8.2 Enrichment Results
- Under the
Input Genomic Region Informationtab,An interactive tablelists user-input genomic regions.
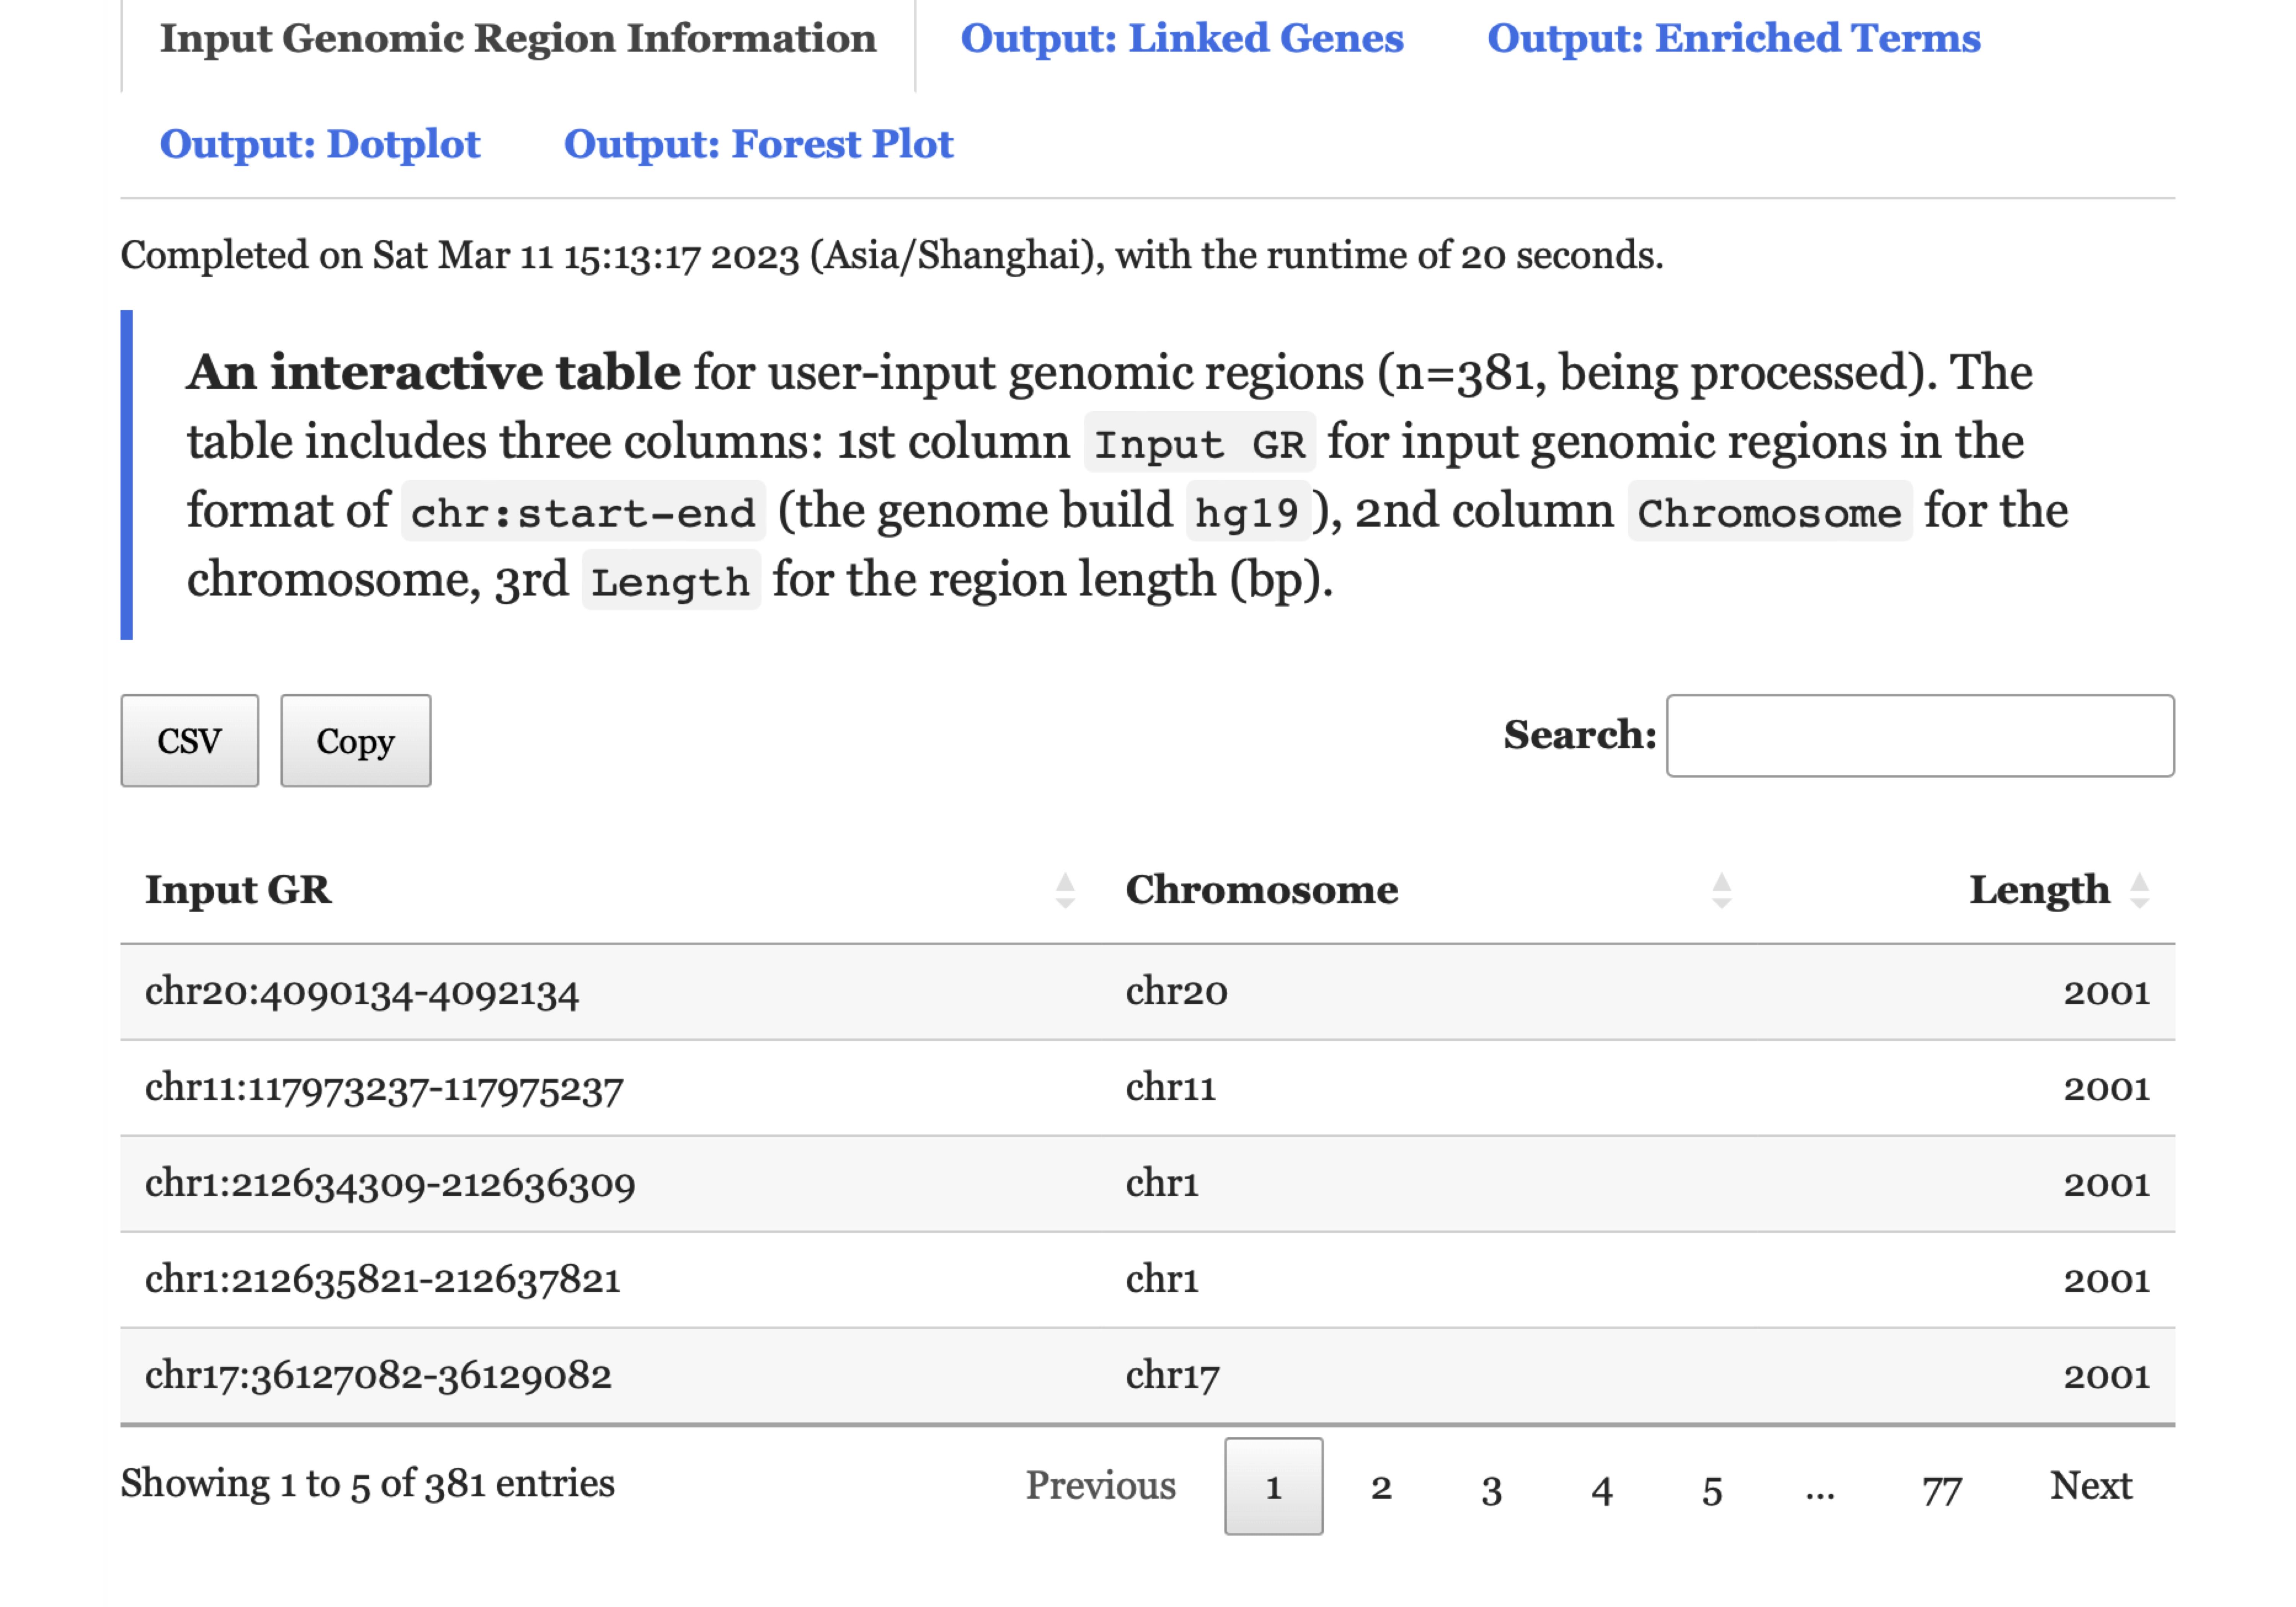
FIGURE 8.2: The user-input data displayed under the Input Genomic Region Information tab for exploration.
- Under the
Output: Linked Genestab,An interactive tablelists genes linked from the input genomic regions.
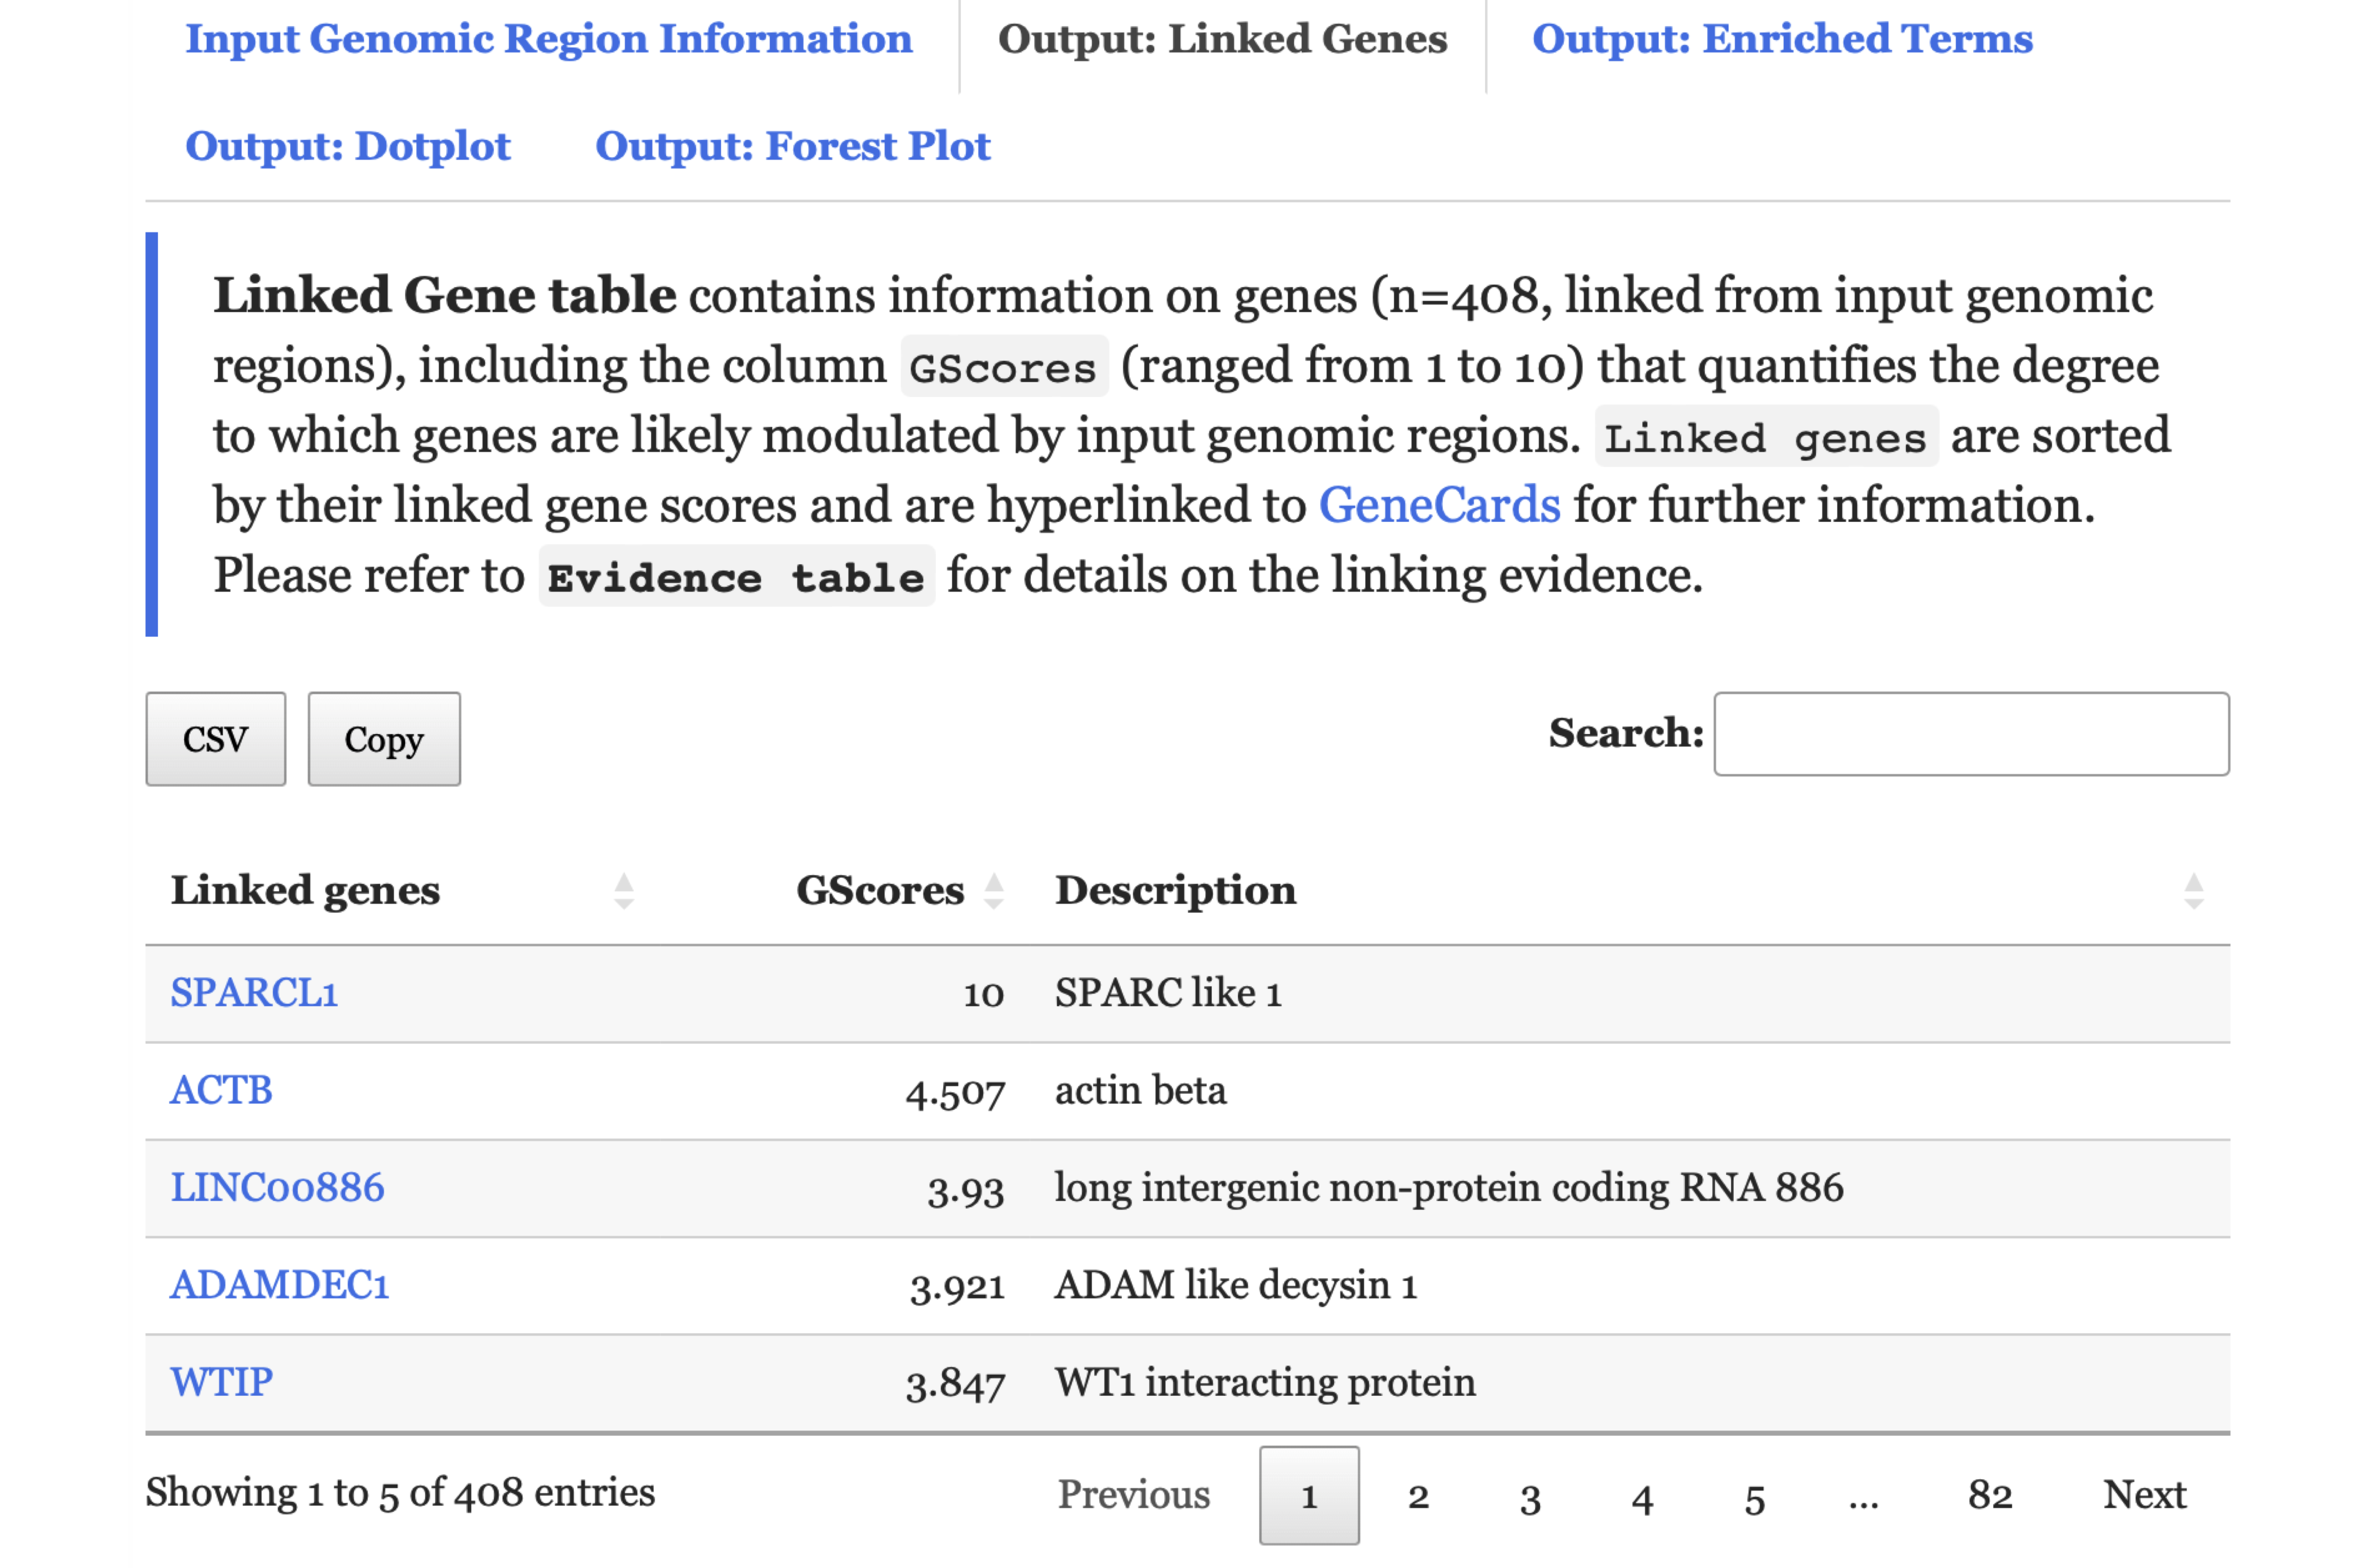
FIGURE 8.3: An interactive table listing genes linked from the input genomic regions under the Output: Linked Genes tab.
- Under the
Output: Enriched Termstab,An interactive tablelists enriched ontology terms.
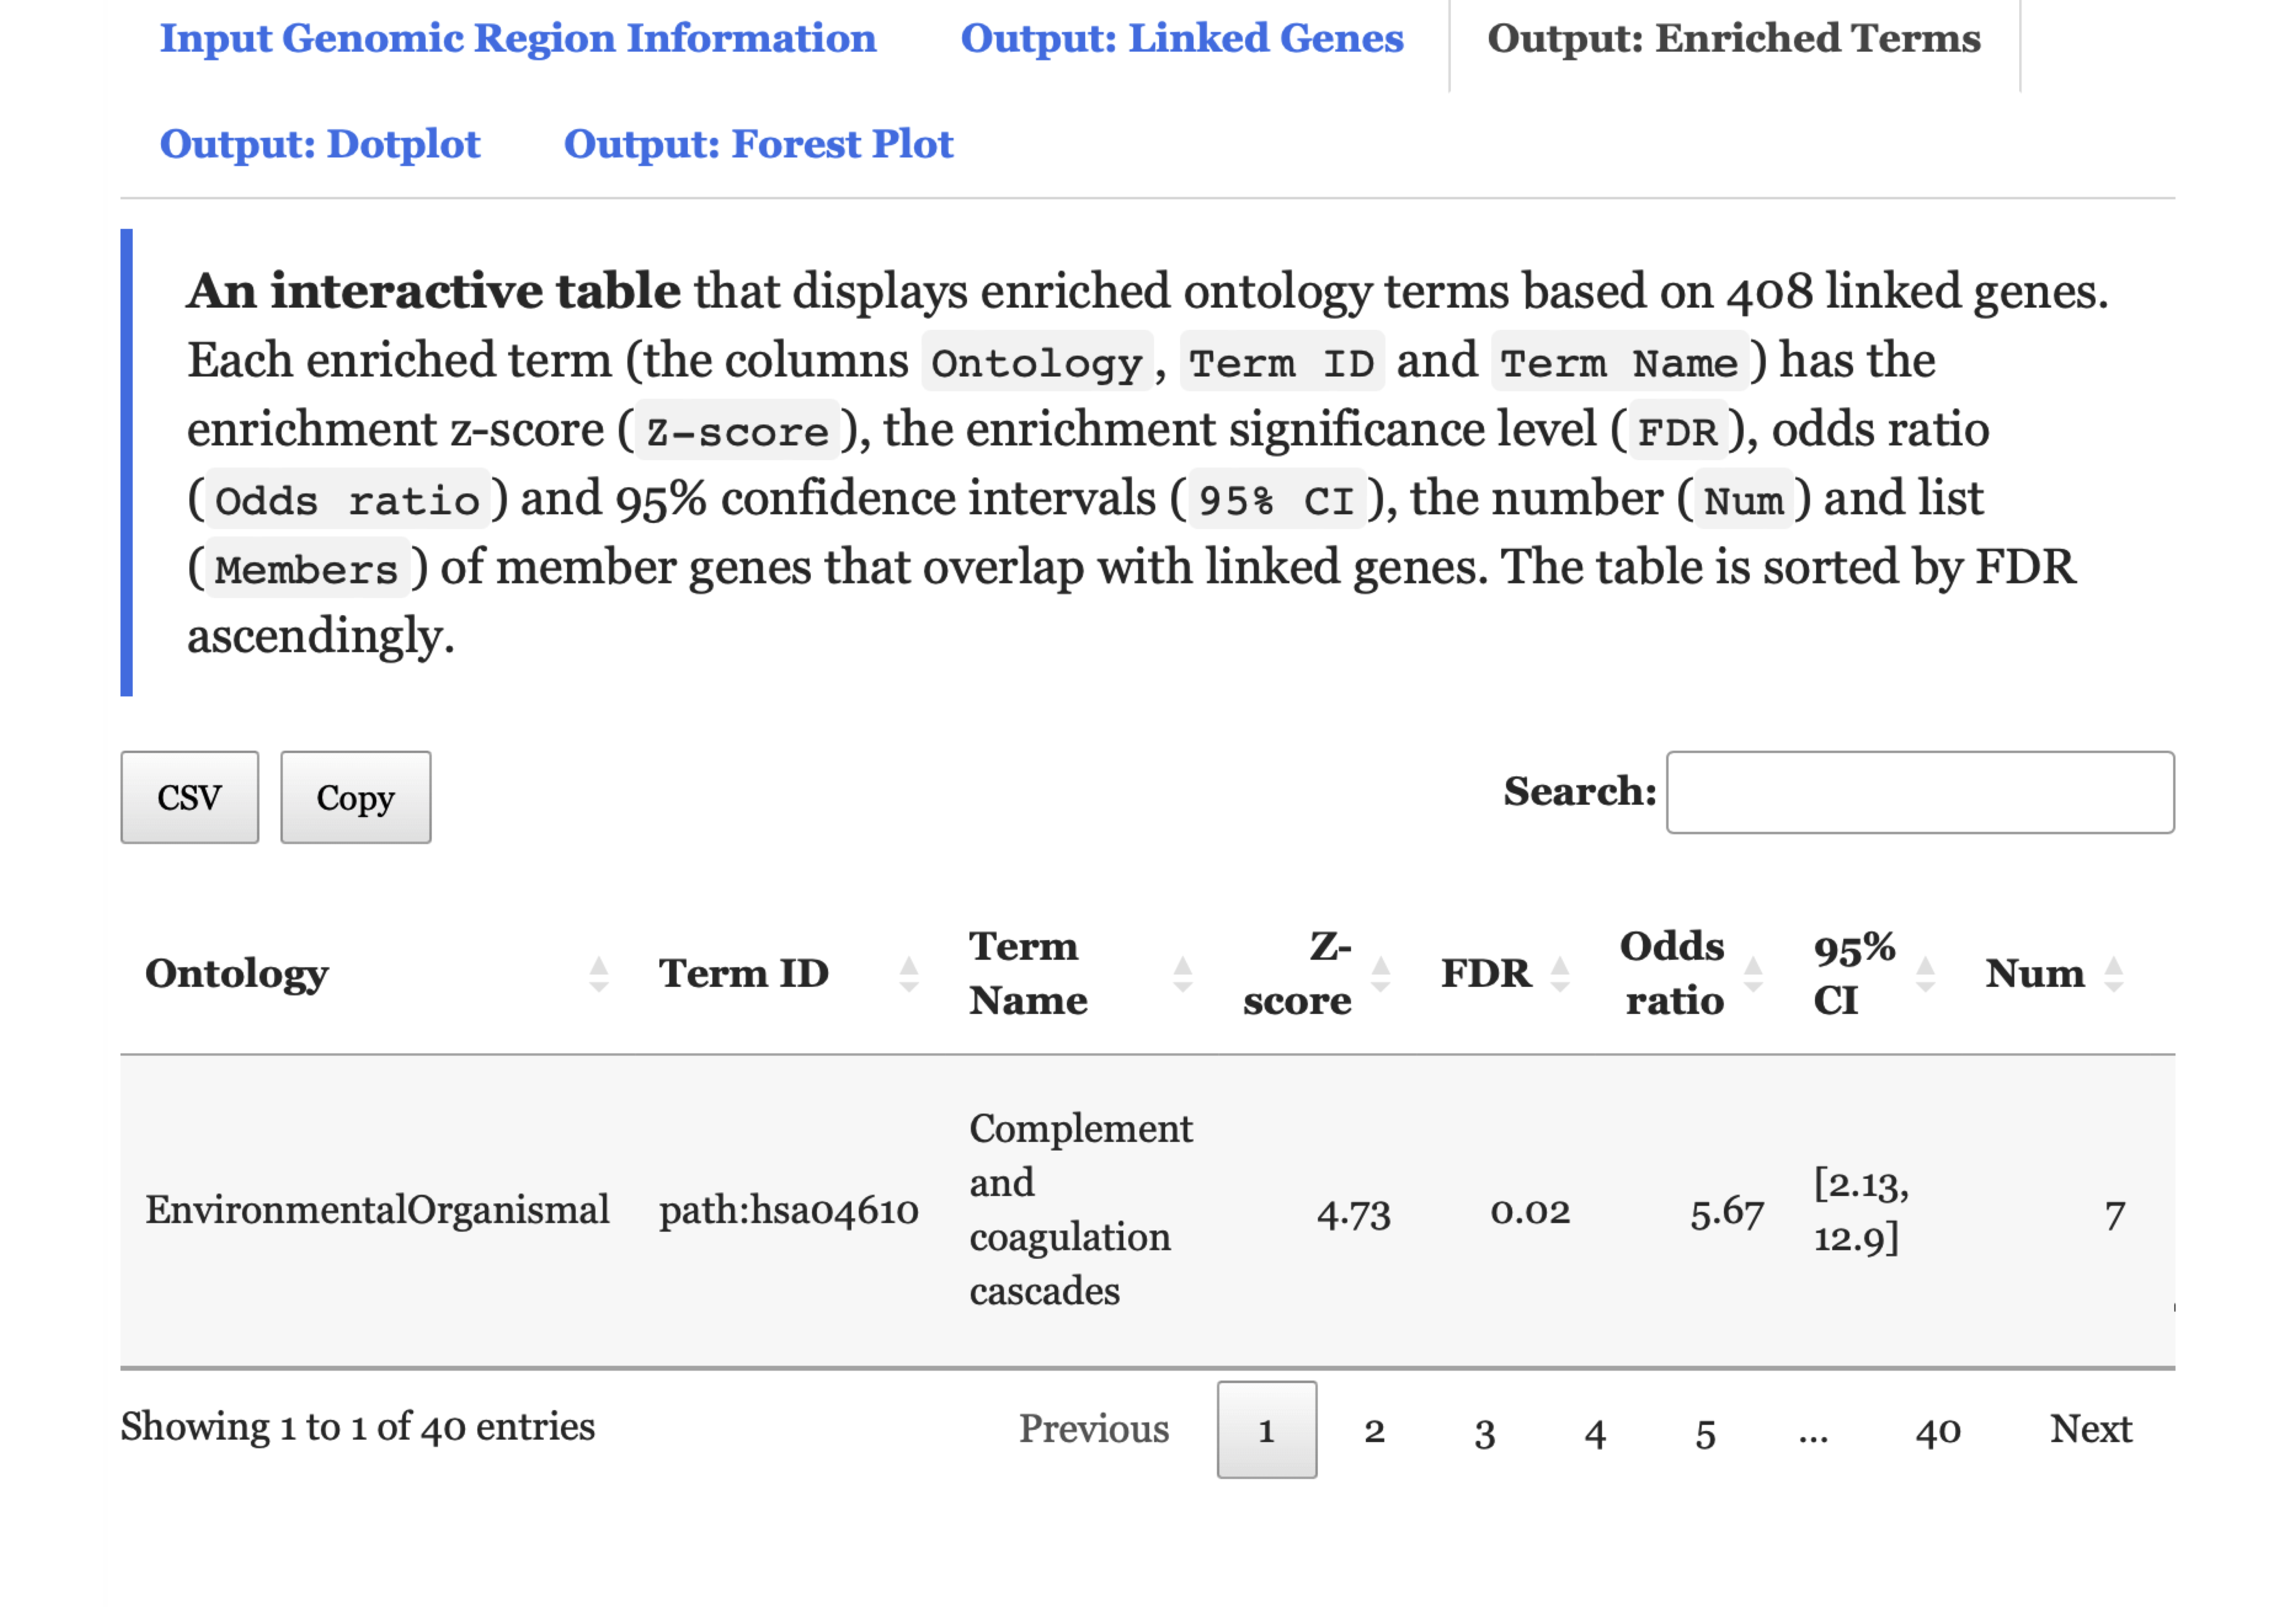
FIGURE 8.4: An interactive table listing enriched ontology terms displayed under the Output: Enriched Terms tab.
- Under the
Output: Dotplottab,A dotplotillustrates enriched ontology terms. A downloadable pdf file is also provided.
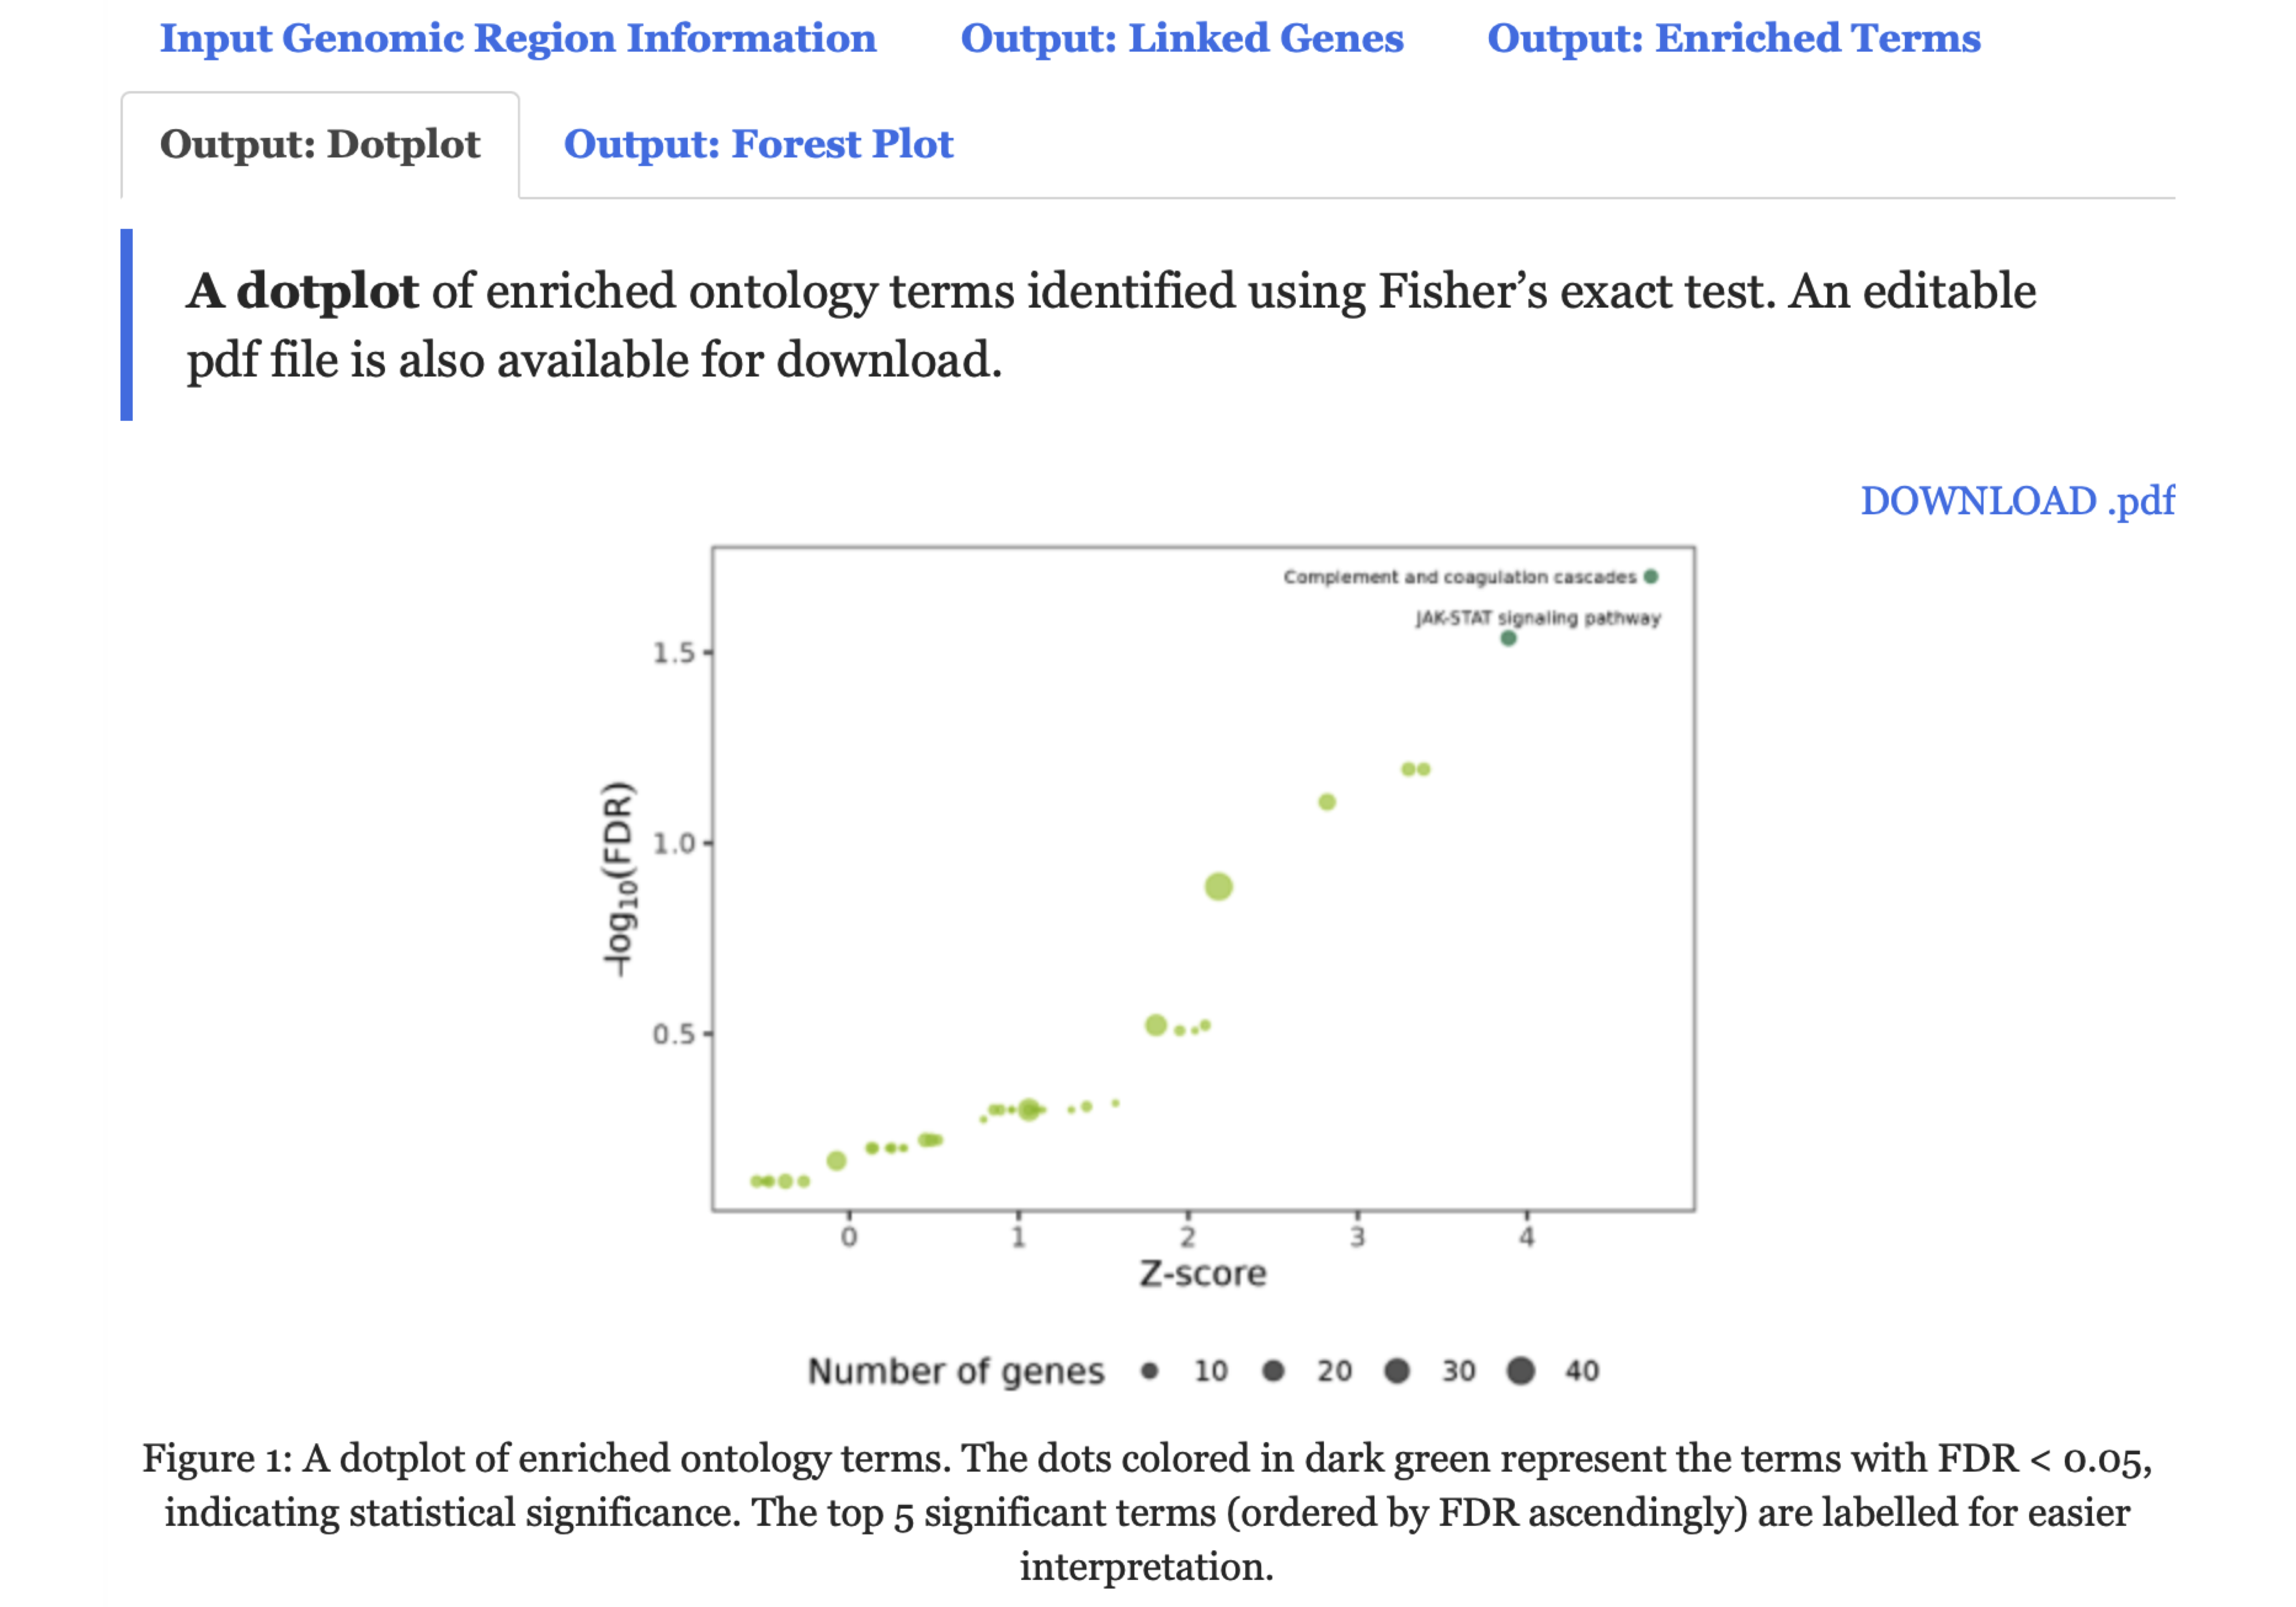
FIGURE 8.5: A dotplot illustrating enriched ontology terms displayed under the Output: Dotplot tab.
- Under the
Output: Forest Plottab,A forest plotillustrates enriched ontology terms. A downloadable pdf file is also provided.
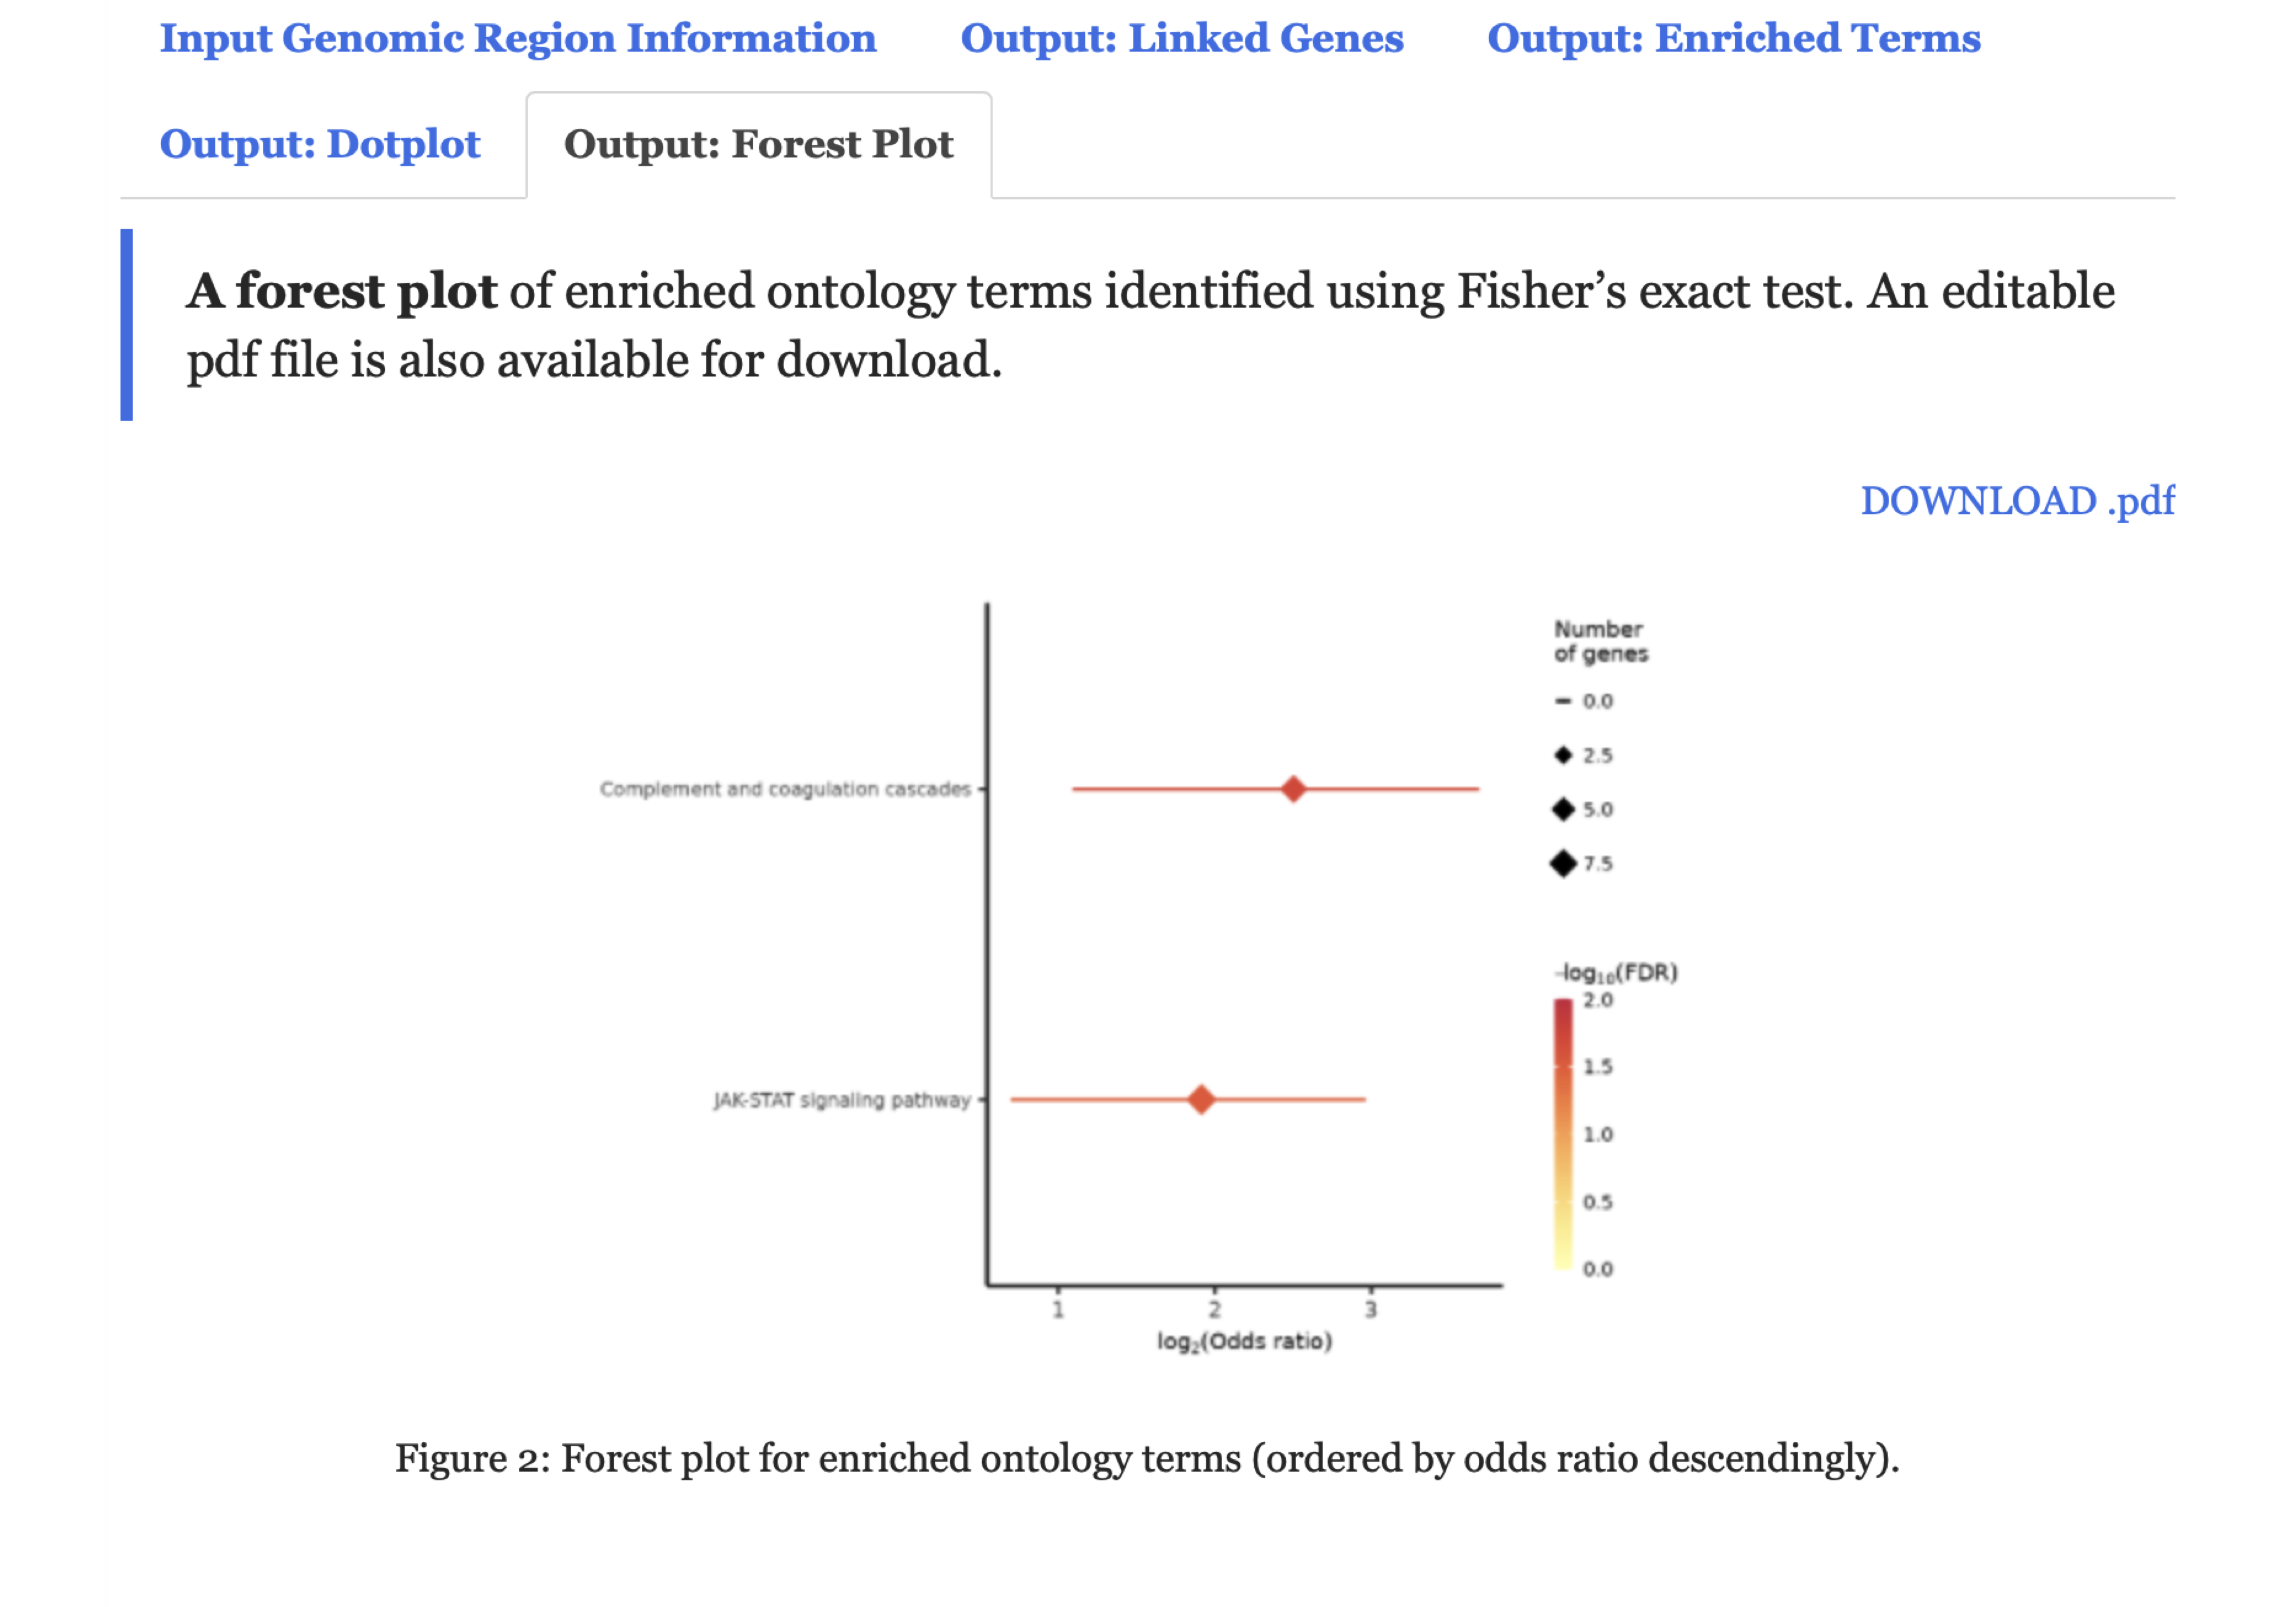
FIGURE 8.6: A forest plot illustrating enriched ontology terms displayed under the Output: Forest Plot tab.