Section 10 SUBNETWORK ANALYSER (SNPS) - SAS
10.1 Input Interface
Input
Step 1: Input a list of SNPs with dbSNP rsIDs in the first column and corresponding significance information (p-values between 0 and 1) in the second column.Step 2: Specify the population to include SNPs in linkage disequilibrium. By default, input SNPs with p-values < 5e−8 are considered. Additional SNPs in linkage disequilibrium (R2 >= 0.8) can also be included according to the specified population.Step 3: Use genomic proximity, quantitative trait locus mapping, or promoter capture Hi-C to identify linked genes.Step 4andStep 5: A subnetwork of highly-scored genes is identified from a gene network (Step 4), with the desired number of genes in the resulting subnetwork (Step 5). The significance (p-value) of observing the identified subnetwork by chance can also be estimated by a degree-preserving node permutation test.More Controls: Use additional parameters to fine-tune the steps described above.SUBMIT: click the SUBMIT button to execute the analysis.
Output
- Example Output includes interactive tables and high-quality figures for the resulting subnetwork. A summary of input data and the runtime (computed on the server side) is also returned for reference.
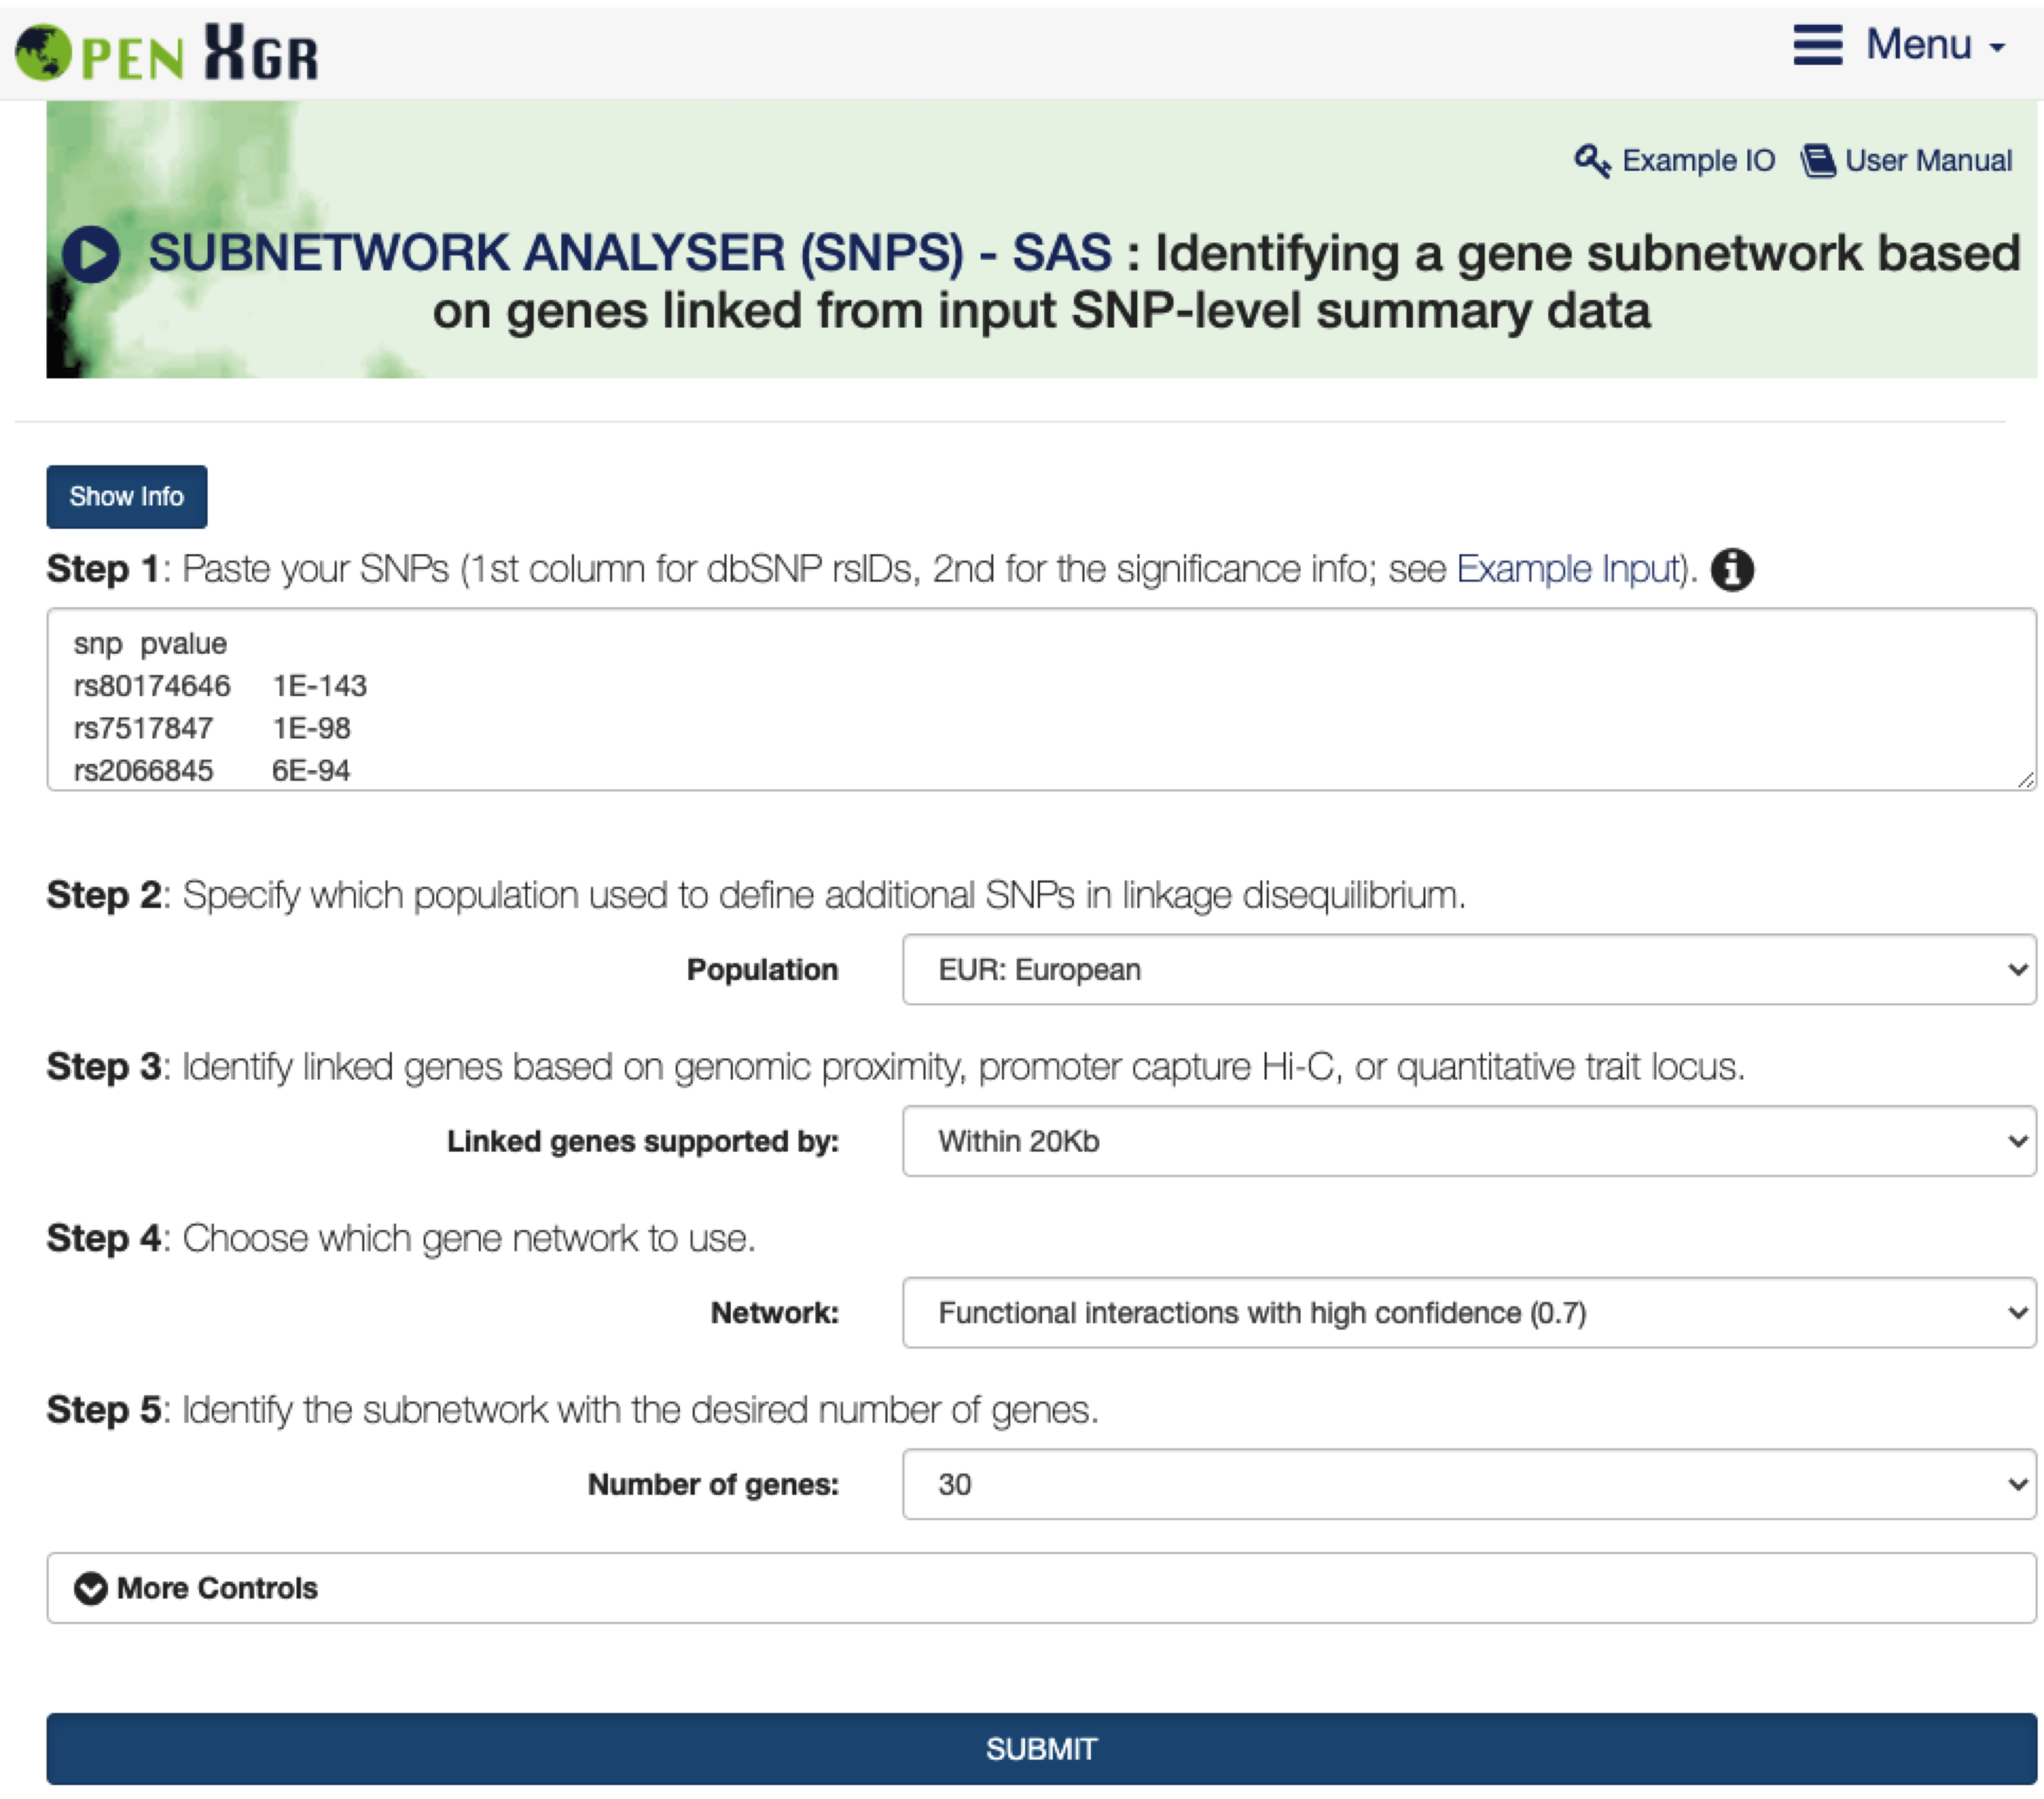
FIGURE 10.1: The interface of SUBNETWORK ANALYSER (SNPS) - SAS. The Show/Hide Info toggle button contains instructions on how to use the interface, including inputs, outputs, and other relevant information.
10.2 Subnetwork Results
- Under the
Input SNP-Level Summary Datatab,An interactive tabledisplays user-input summary data.
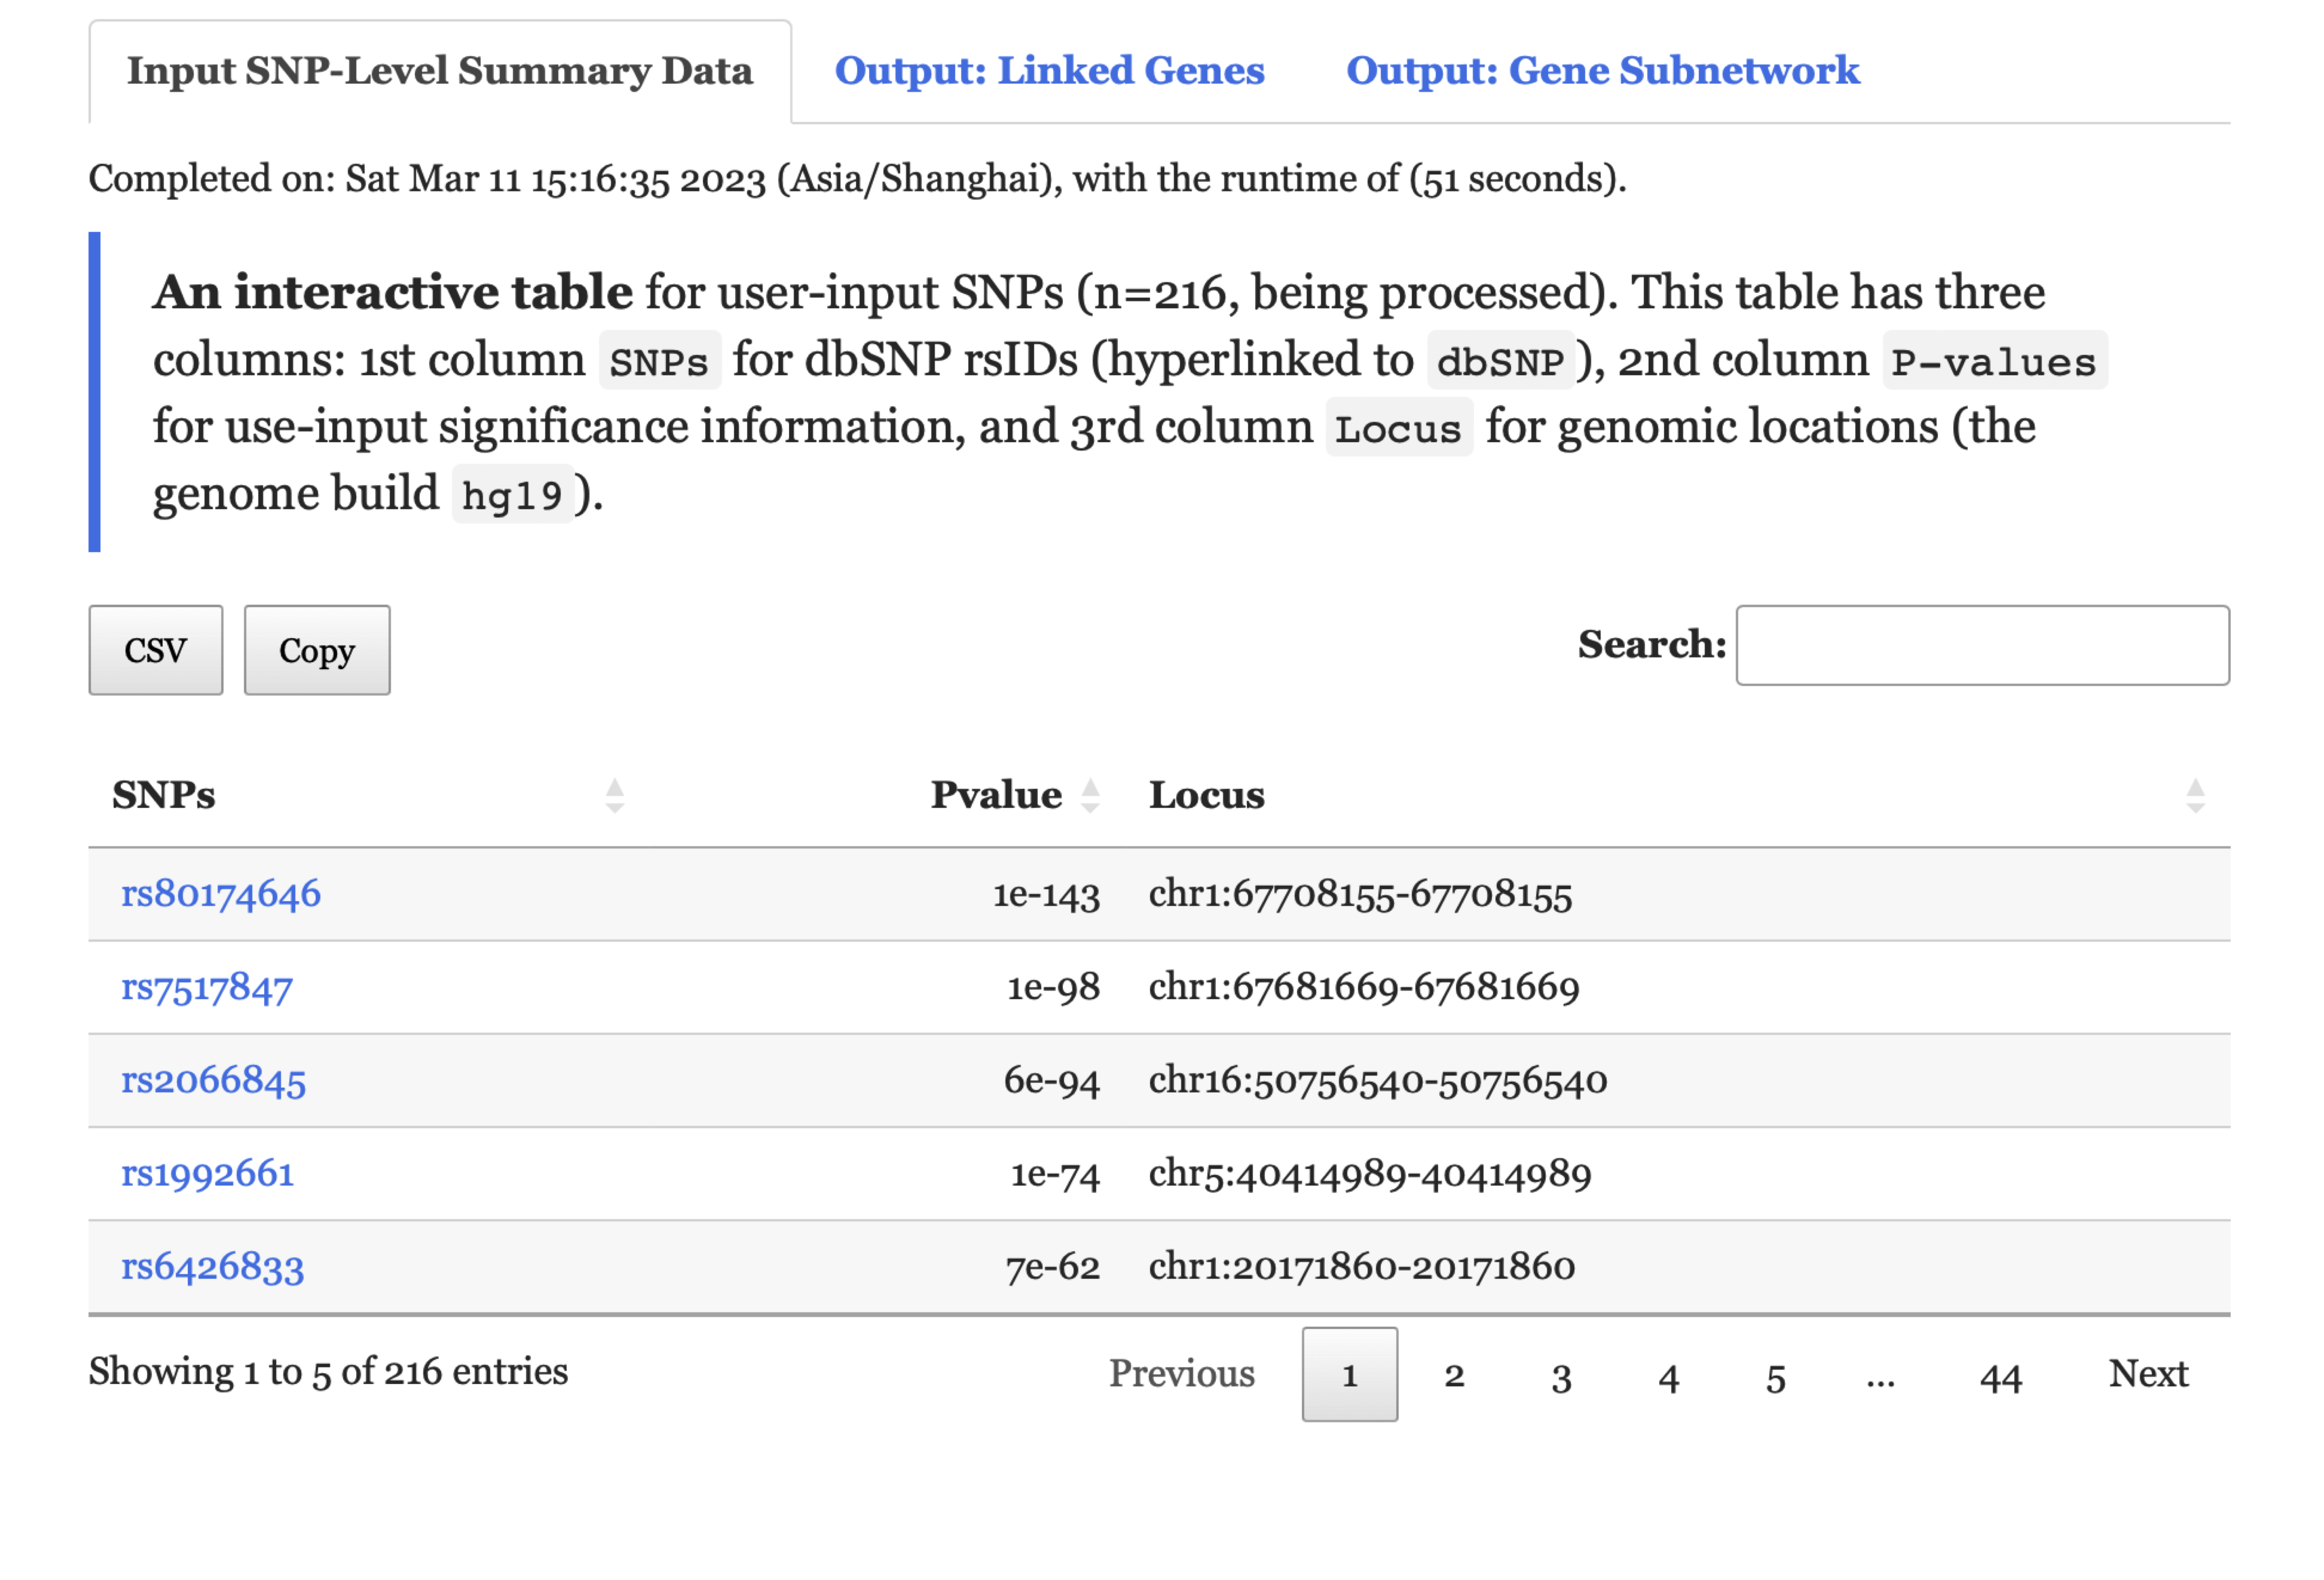
FIGURE 10.2: An interactive table displaying user-input summary under the Input SNP-Level Summary Data tab returned for exploration.
- Under the tab
Output: Linked Genes,An interactive tablelists genes linked from the input SNPs.
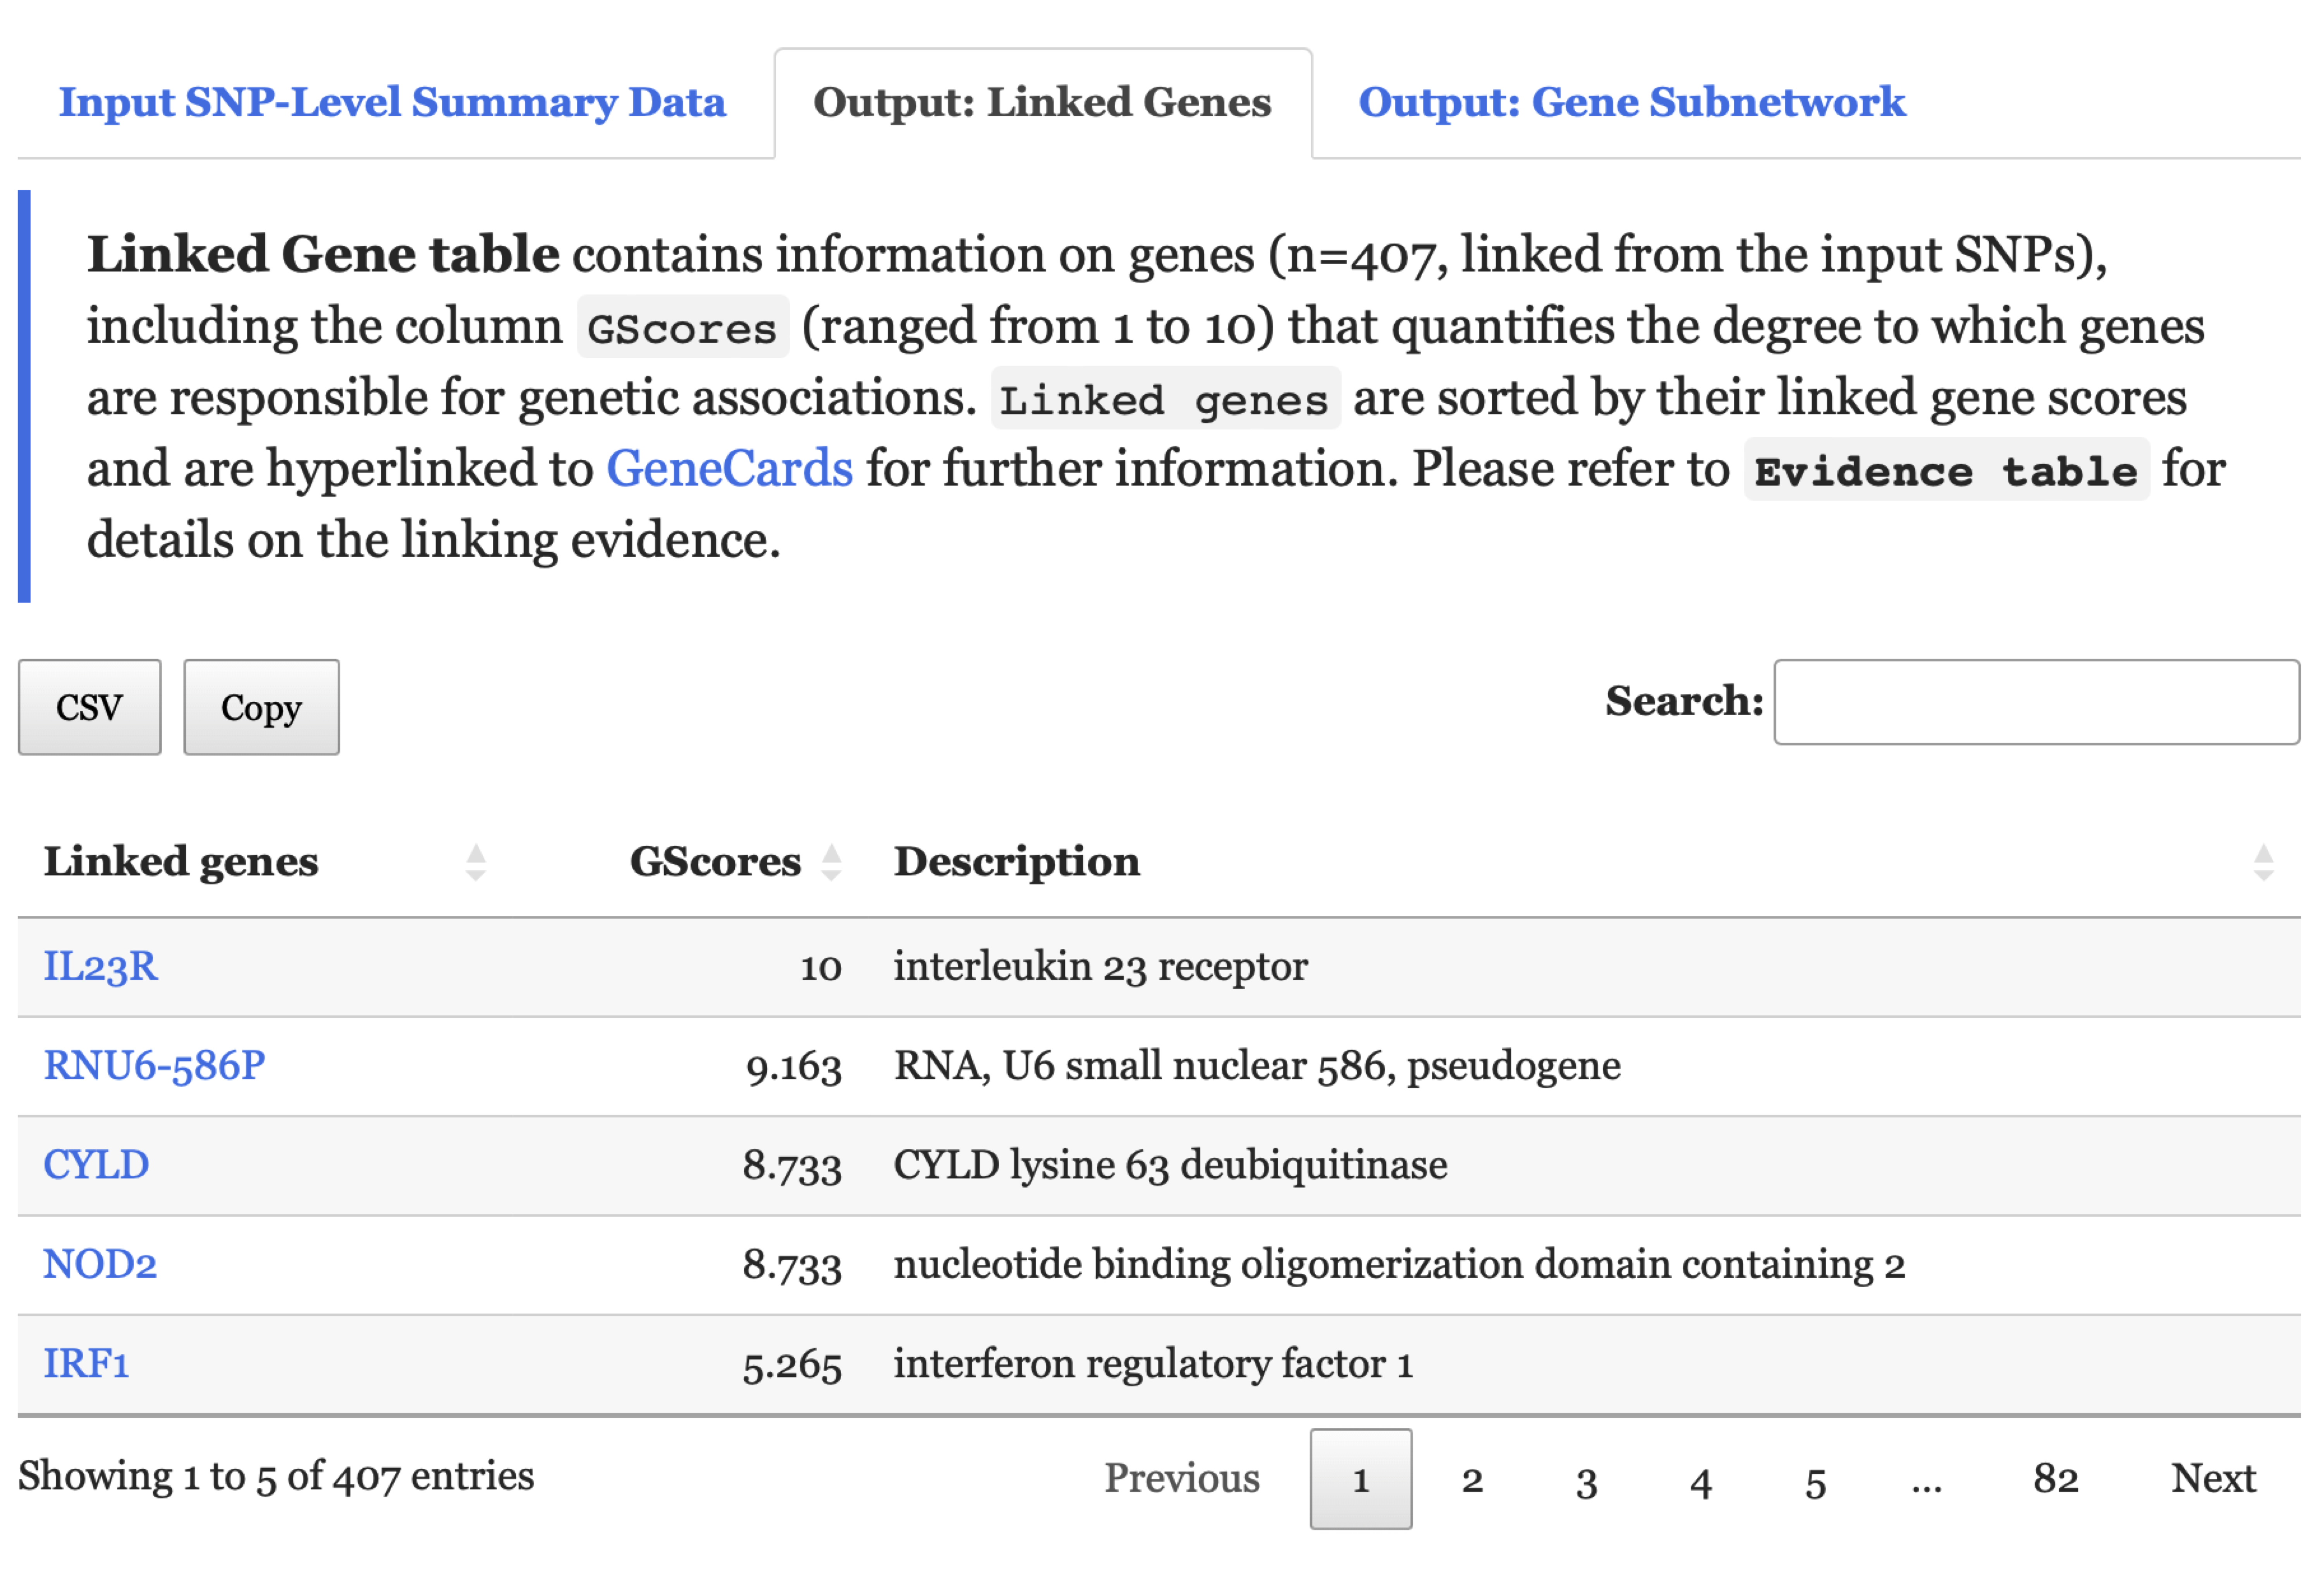
FIGURE 10.3: An interactive table listing genes linked from input SNPs under the Output: Linked Genes tab.
- Under the
Output: Gene Subnetworktab,A network visualisationof the subnetwork is provided, along withAn interactive tablefor the subnetwork genes.
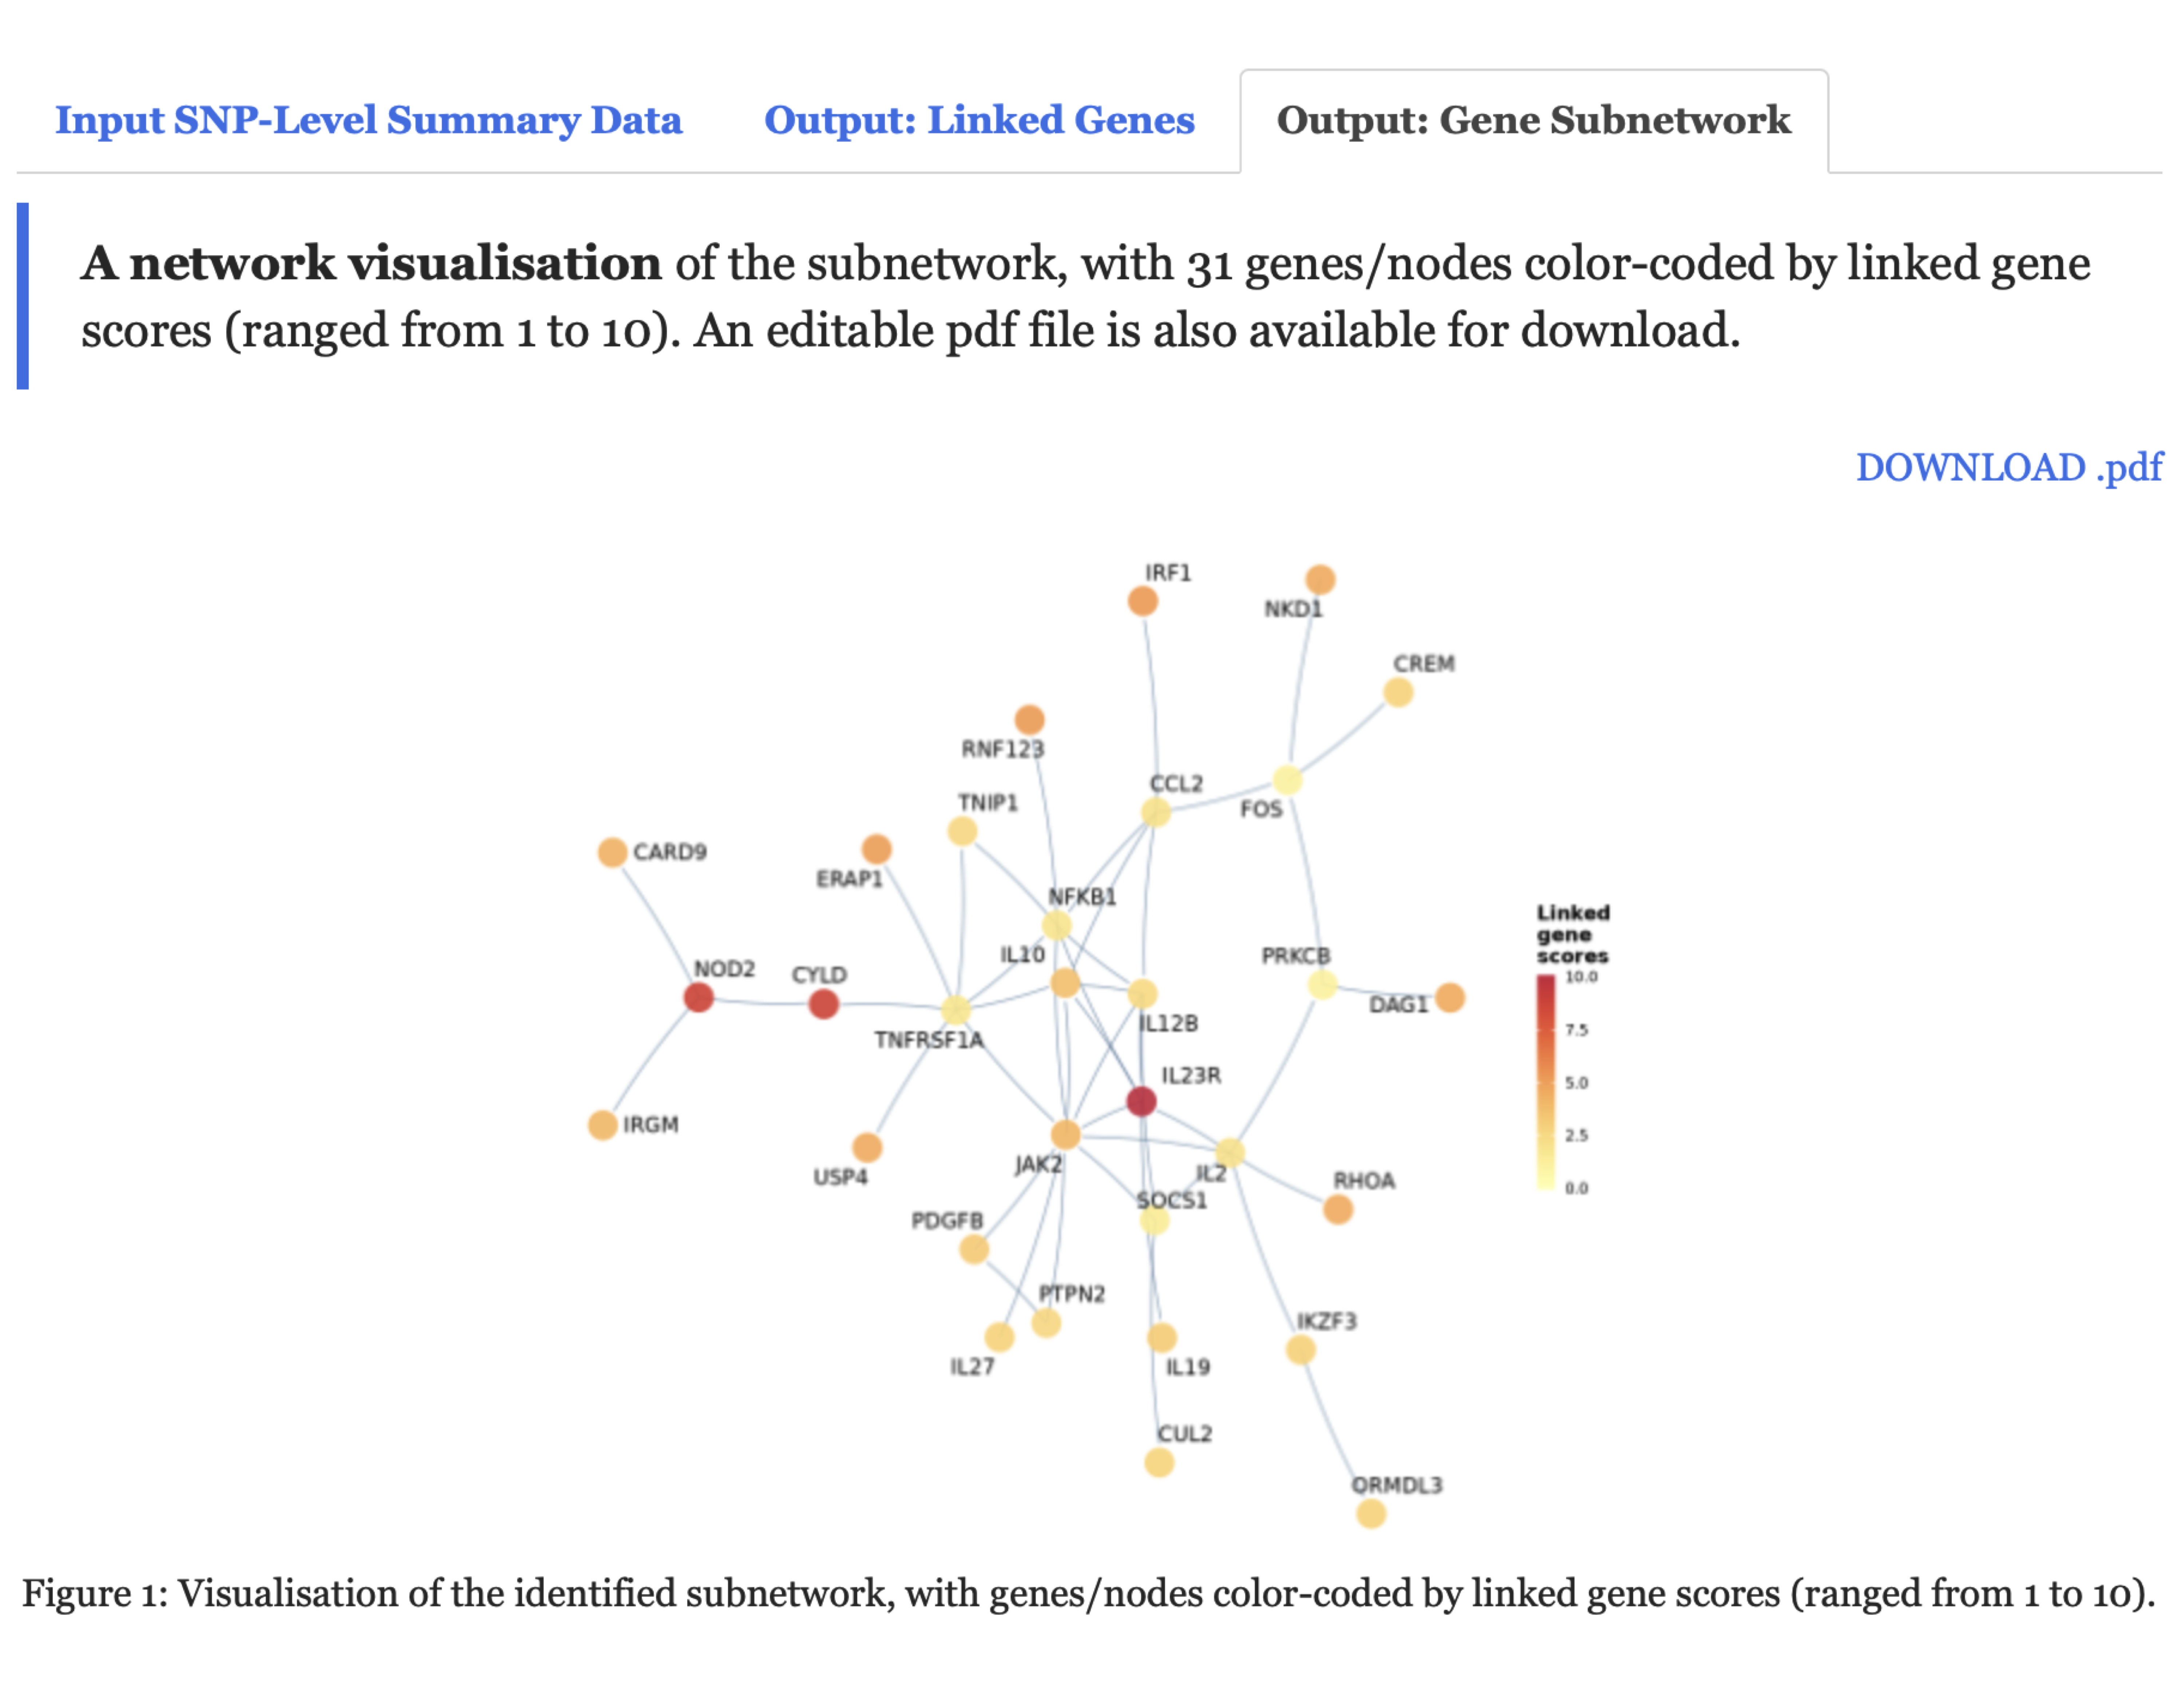
FIGURE 10.4: A network visualisation of the resulting subnetwork, with genes/nodes color-coded by linked gene scores (ranged from 1 to 10) under the Output: Gene Subnetwork tab.