Section 7 ENRICHMENT ANALYSER (SNPS) - EAS
7.1 Input Interface
Input
Step 1: Enter a list of SNPs, where the 1st column contains dbSNP rsIDs and the 2nd column for the significance information (p-values ranging between 0 and 1).Step 2: Specify the population to include SNPs in linkage disequilibrium. By default, input SNPs with p-values < 5e−8 are considered, and additional SNPs in linkage disequilibrium (R2 >= 0.8) can be included according to the specified population.Step 3: Use genomic proximity, quantitative trait locus mapping, or promoter capture Hi-C to identify linked genes.Step 4: Select from a list of supported ontologies.More Controls: Use additional parameters to fine-tune the steps described above.SUBMIT: click the SUBMIT button to execute the analysis.
Output
- Example Output includes interactive tables and high-quality figures for enrichment results. A summary of input data and the runtime (computed on the server side) is also returned for reference.
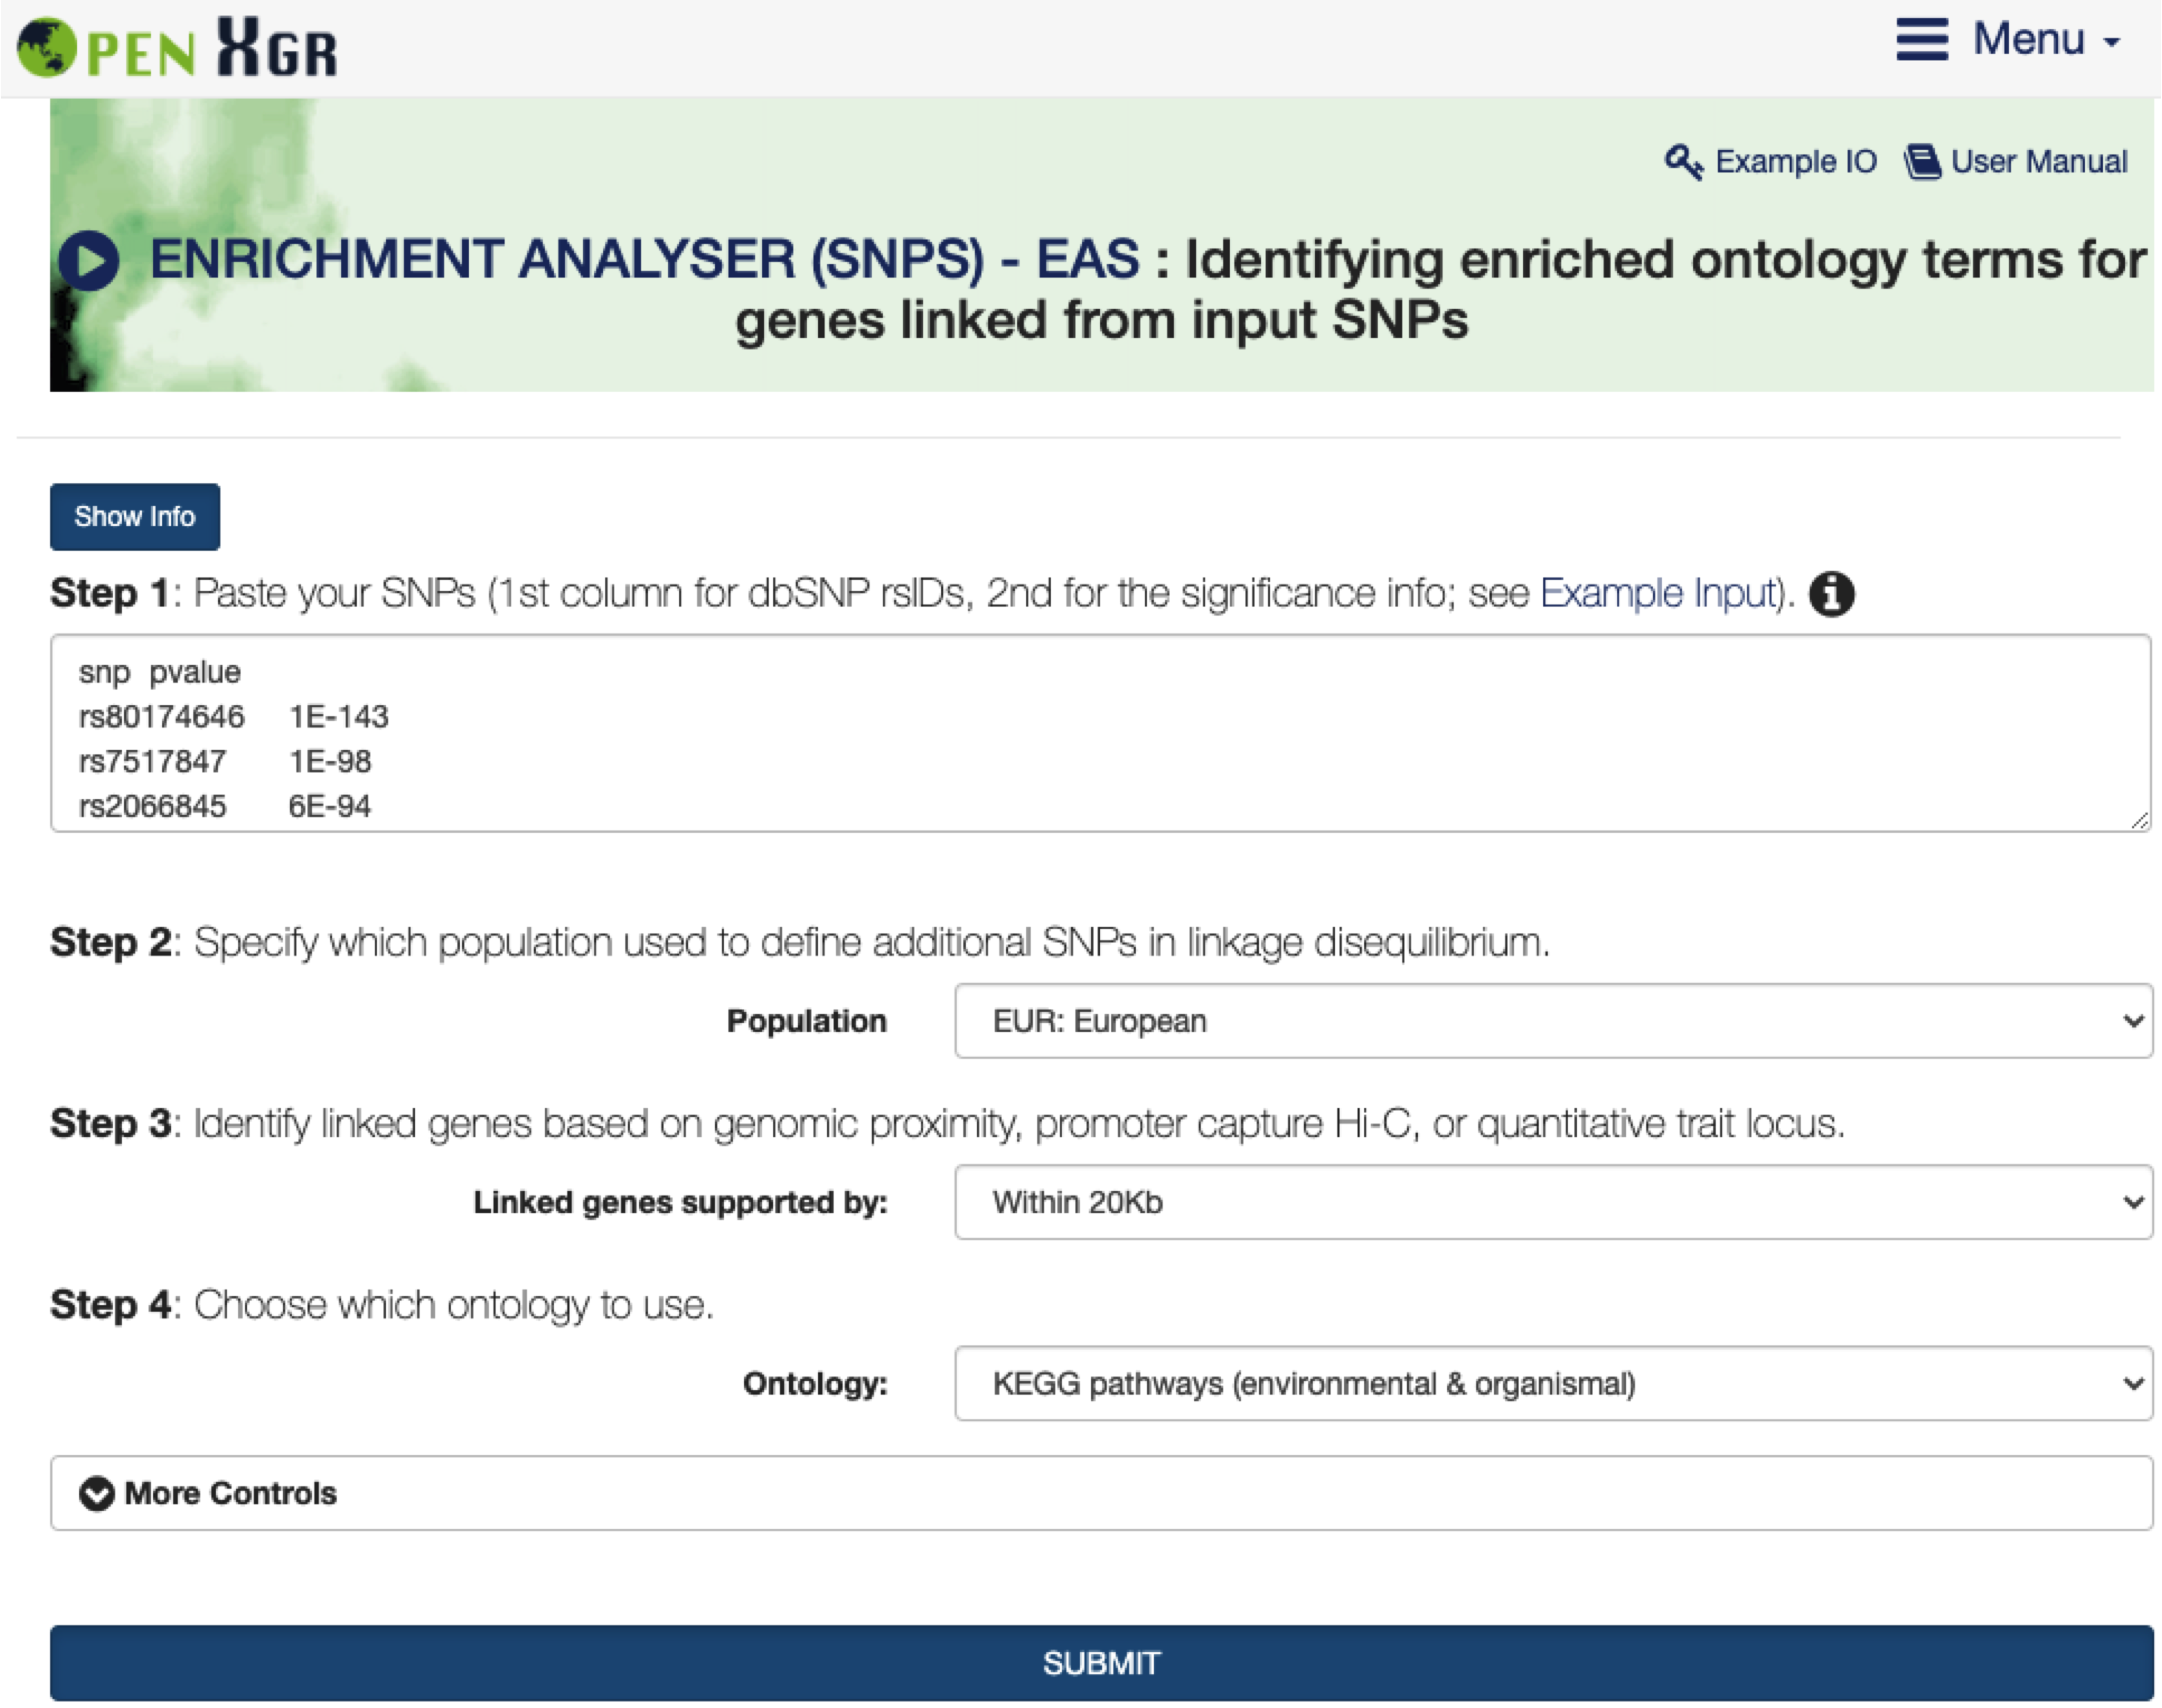
FIGURE 7.1: The interface of ENRICHMENT ANALYSER (SNPS) - EAS. The Show/Hide Info toggle button contains the help information on inputs, outputs, and other information.
7.2 Enrichment Results
- Under the
Input SNP Informationtab,An interactive tablelists the user-input SNPs.
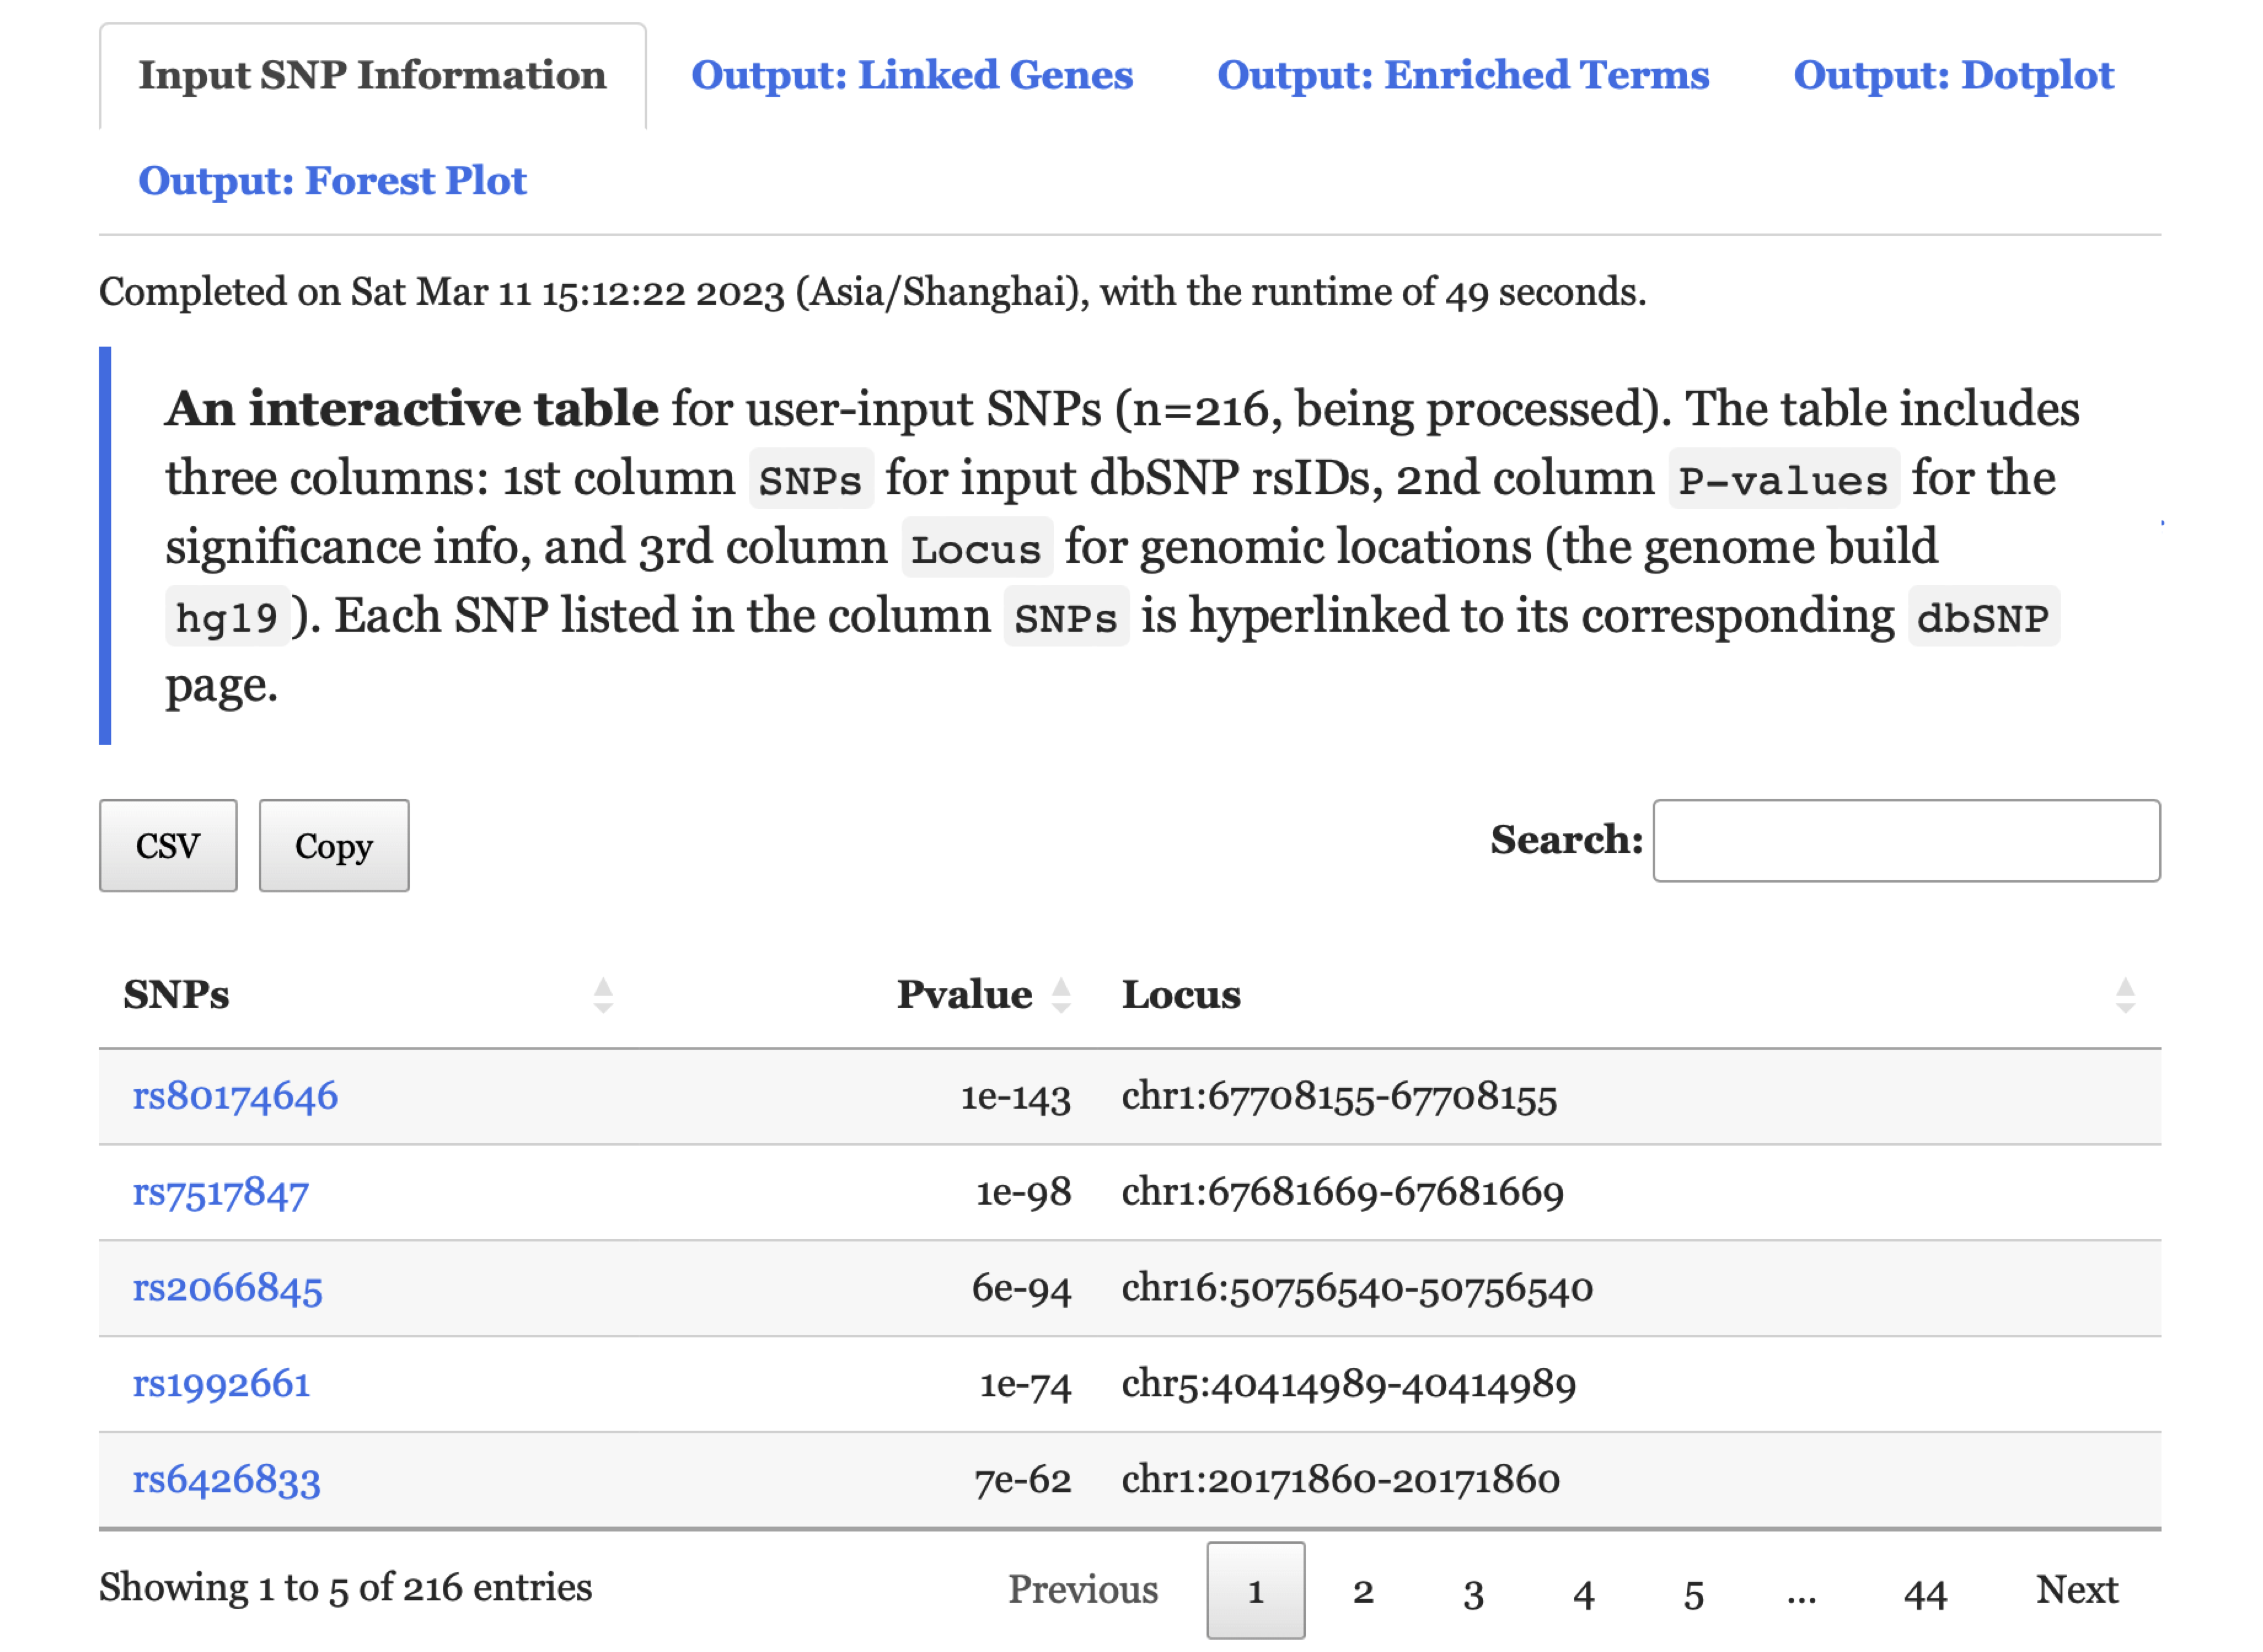
FIGURE 7.2: The user-input data under the Input SNP Information tab returned for exploration.
- Under the
Output: Linked Genestab,An interactive tablelists genes linked from the input SNPs.
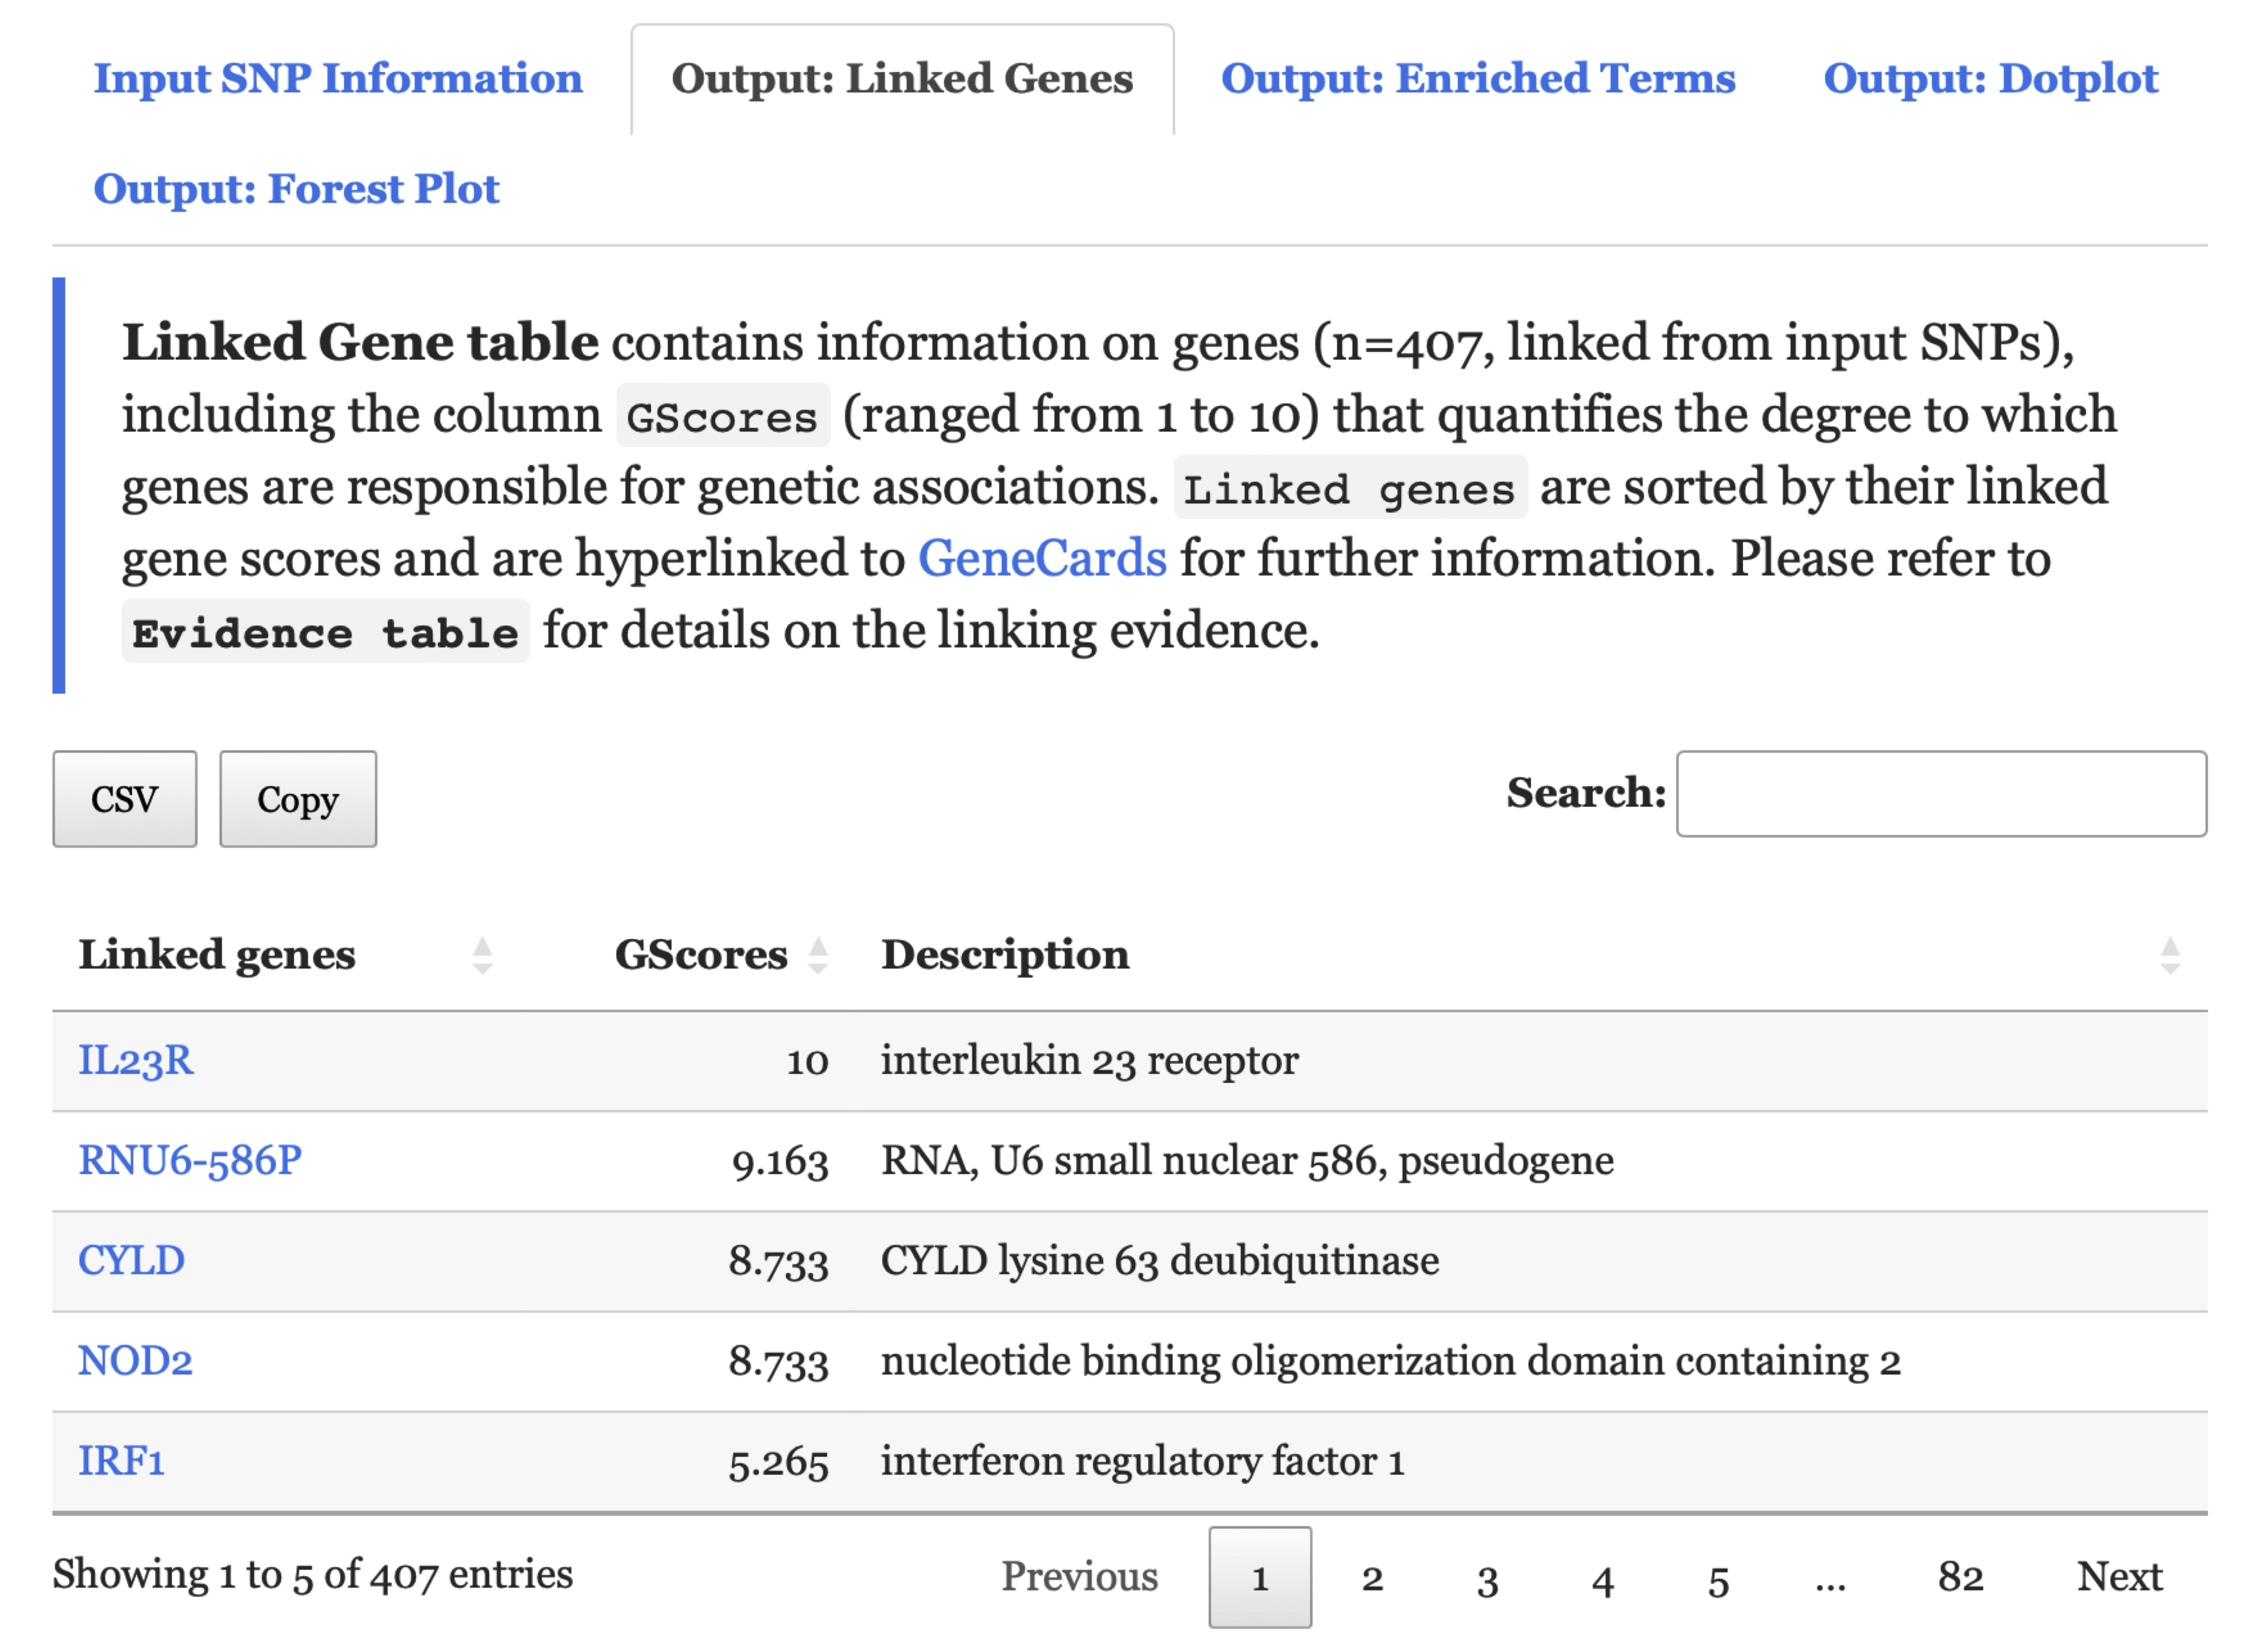
FIGURE 7.3: An interactive table listing genes linked from the input SNPs under the Output: Linked Genes tab.
- Under the
Output: Enriched Termstab,An interactive tablelists enriched ontology terms.
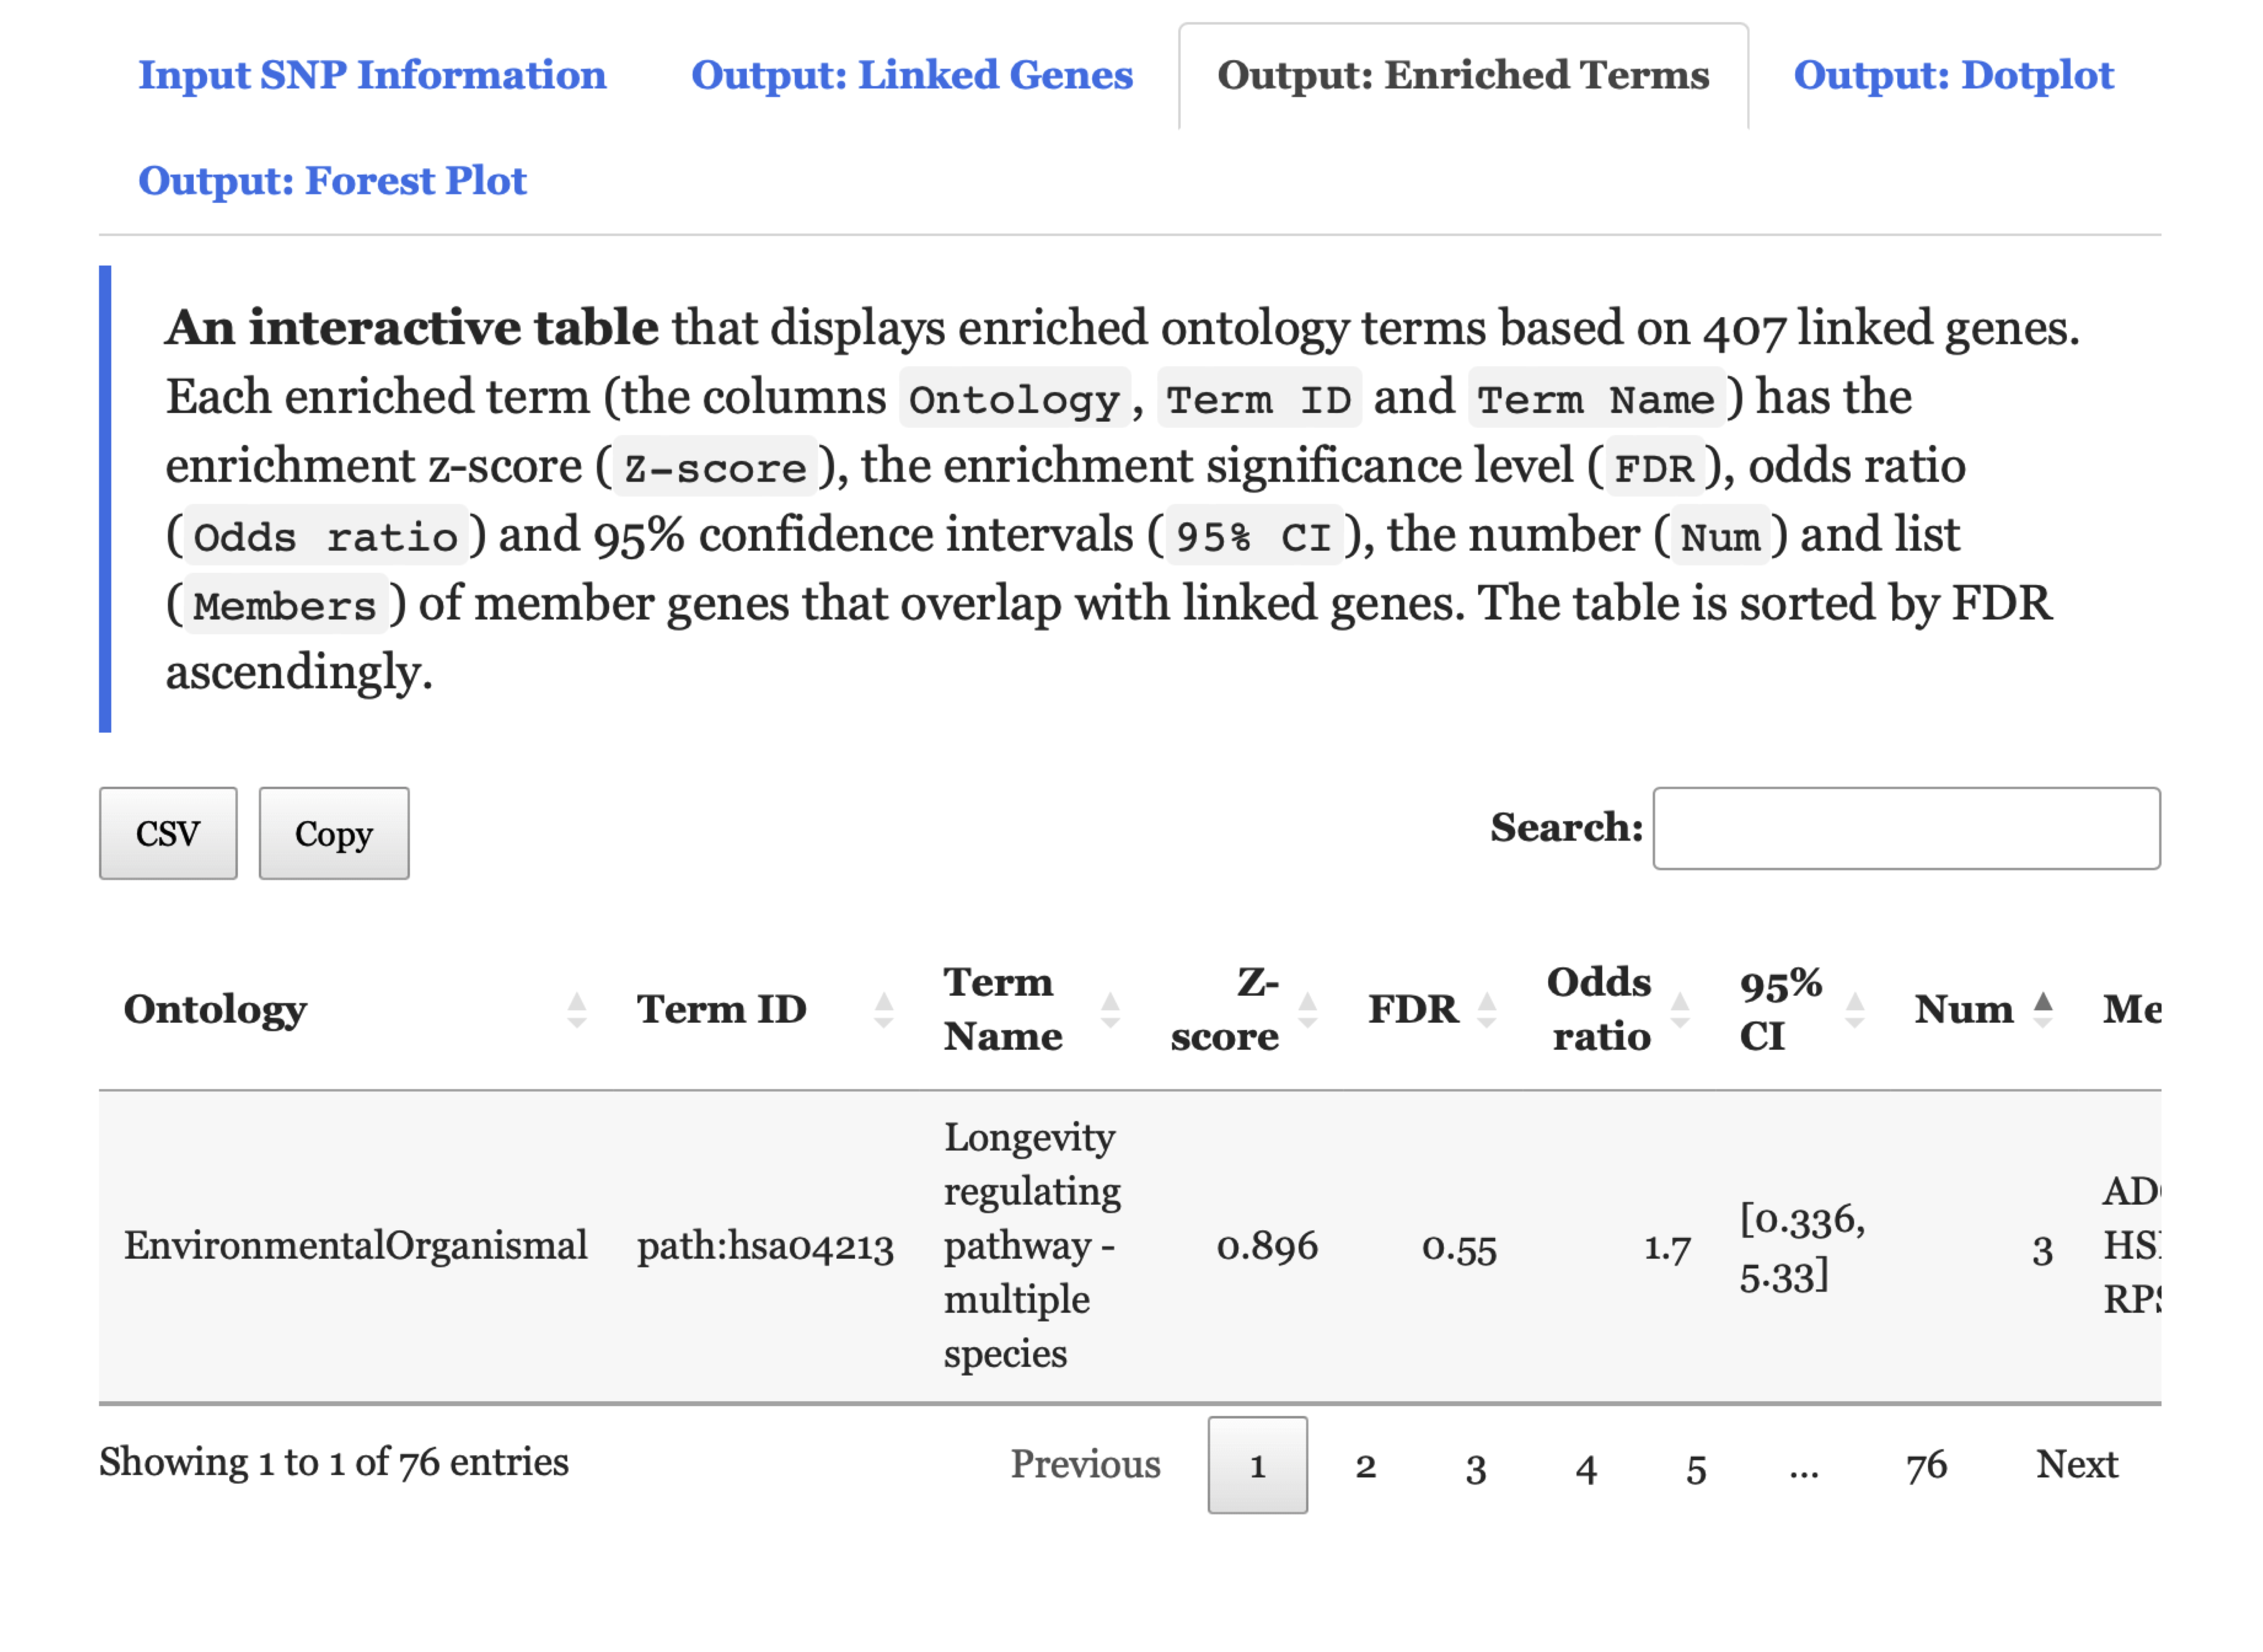
FIGURE 7.4: An interactive table lists enriched ontology terms under the Output: Enriched Terms tab.
- Under the
Output: Dotplottab,A dotplotillustrates enriched ontology terms. A downloadable pdf file is also provided.
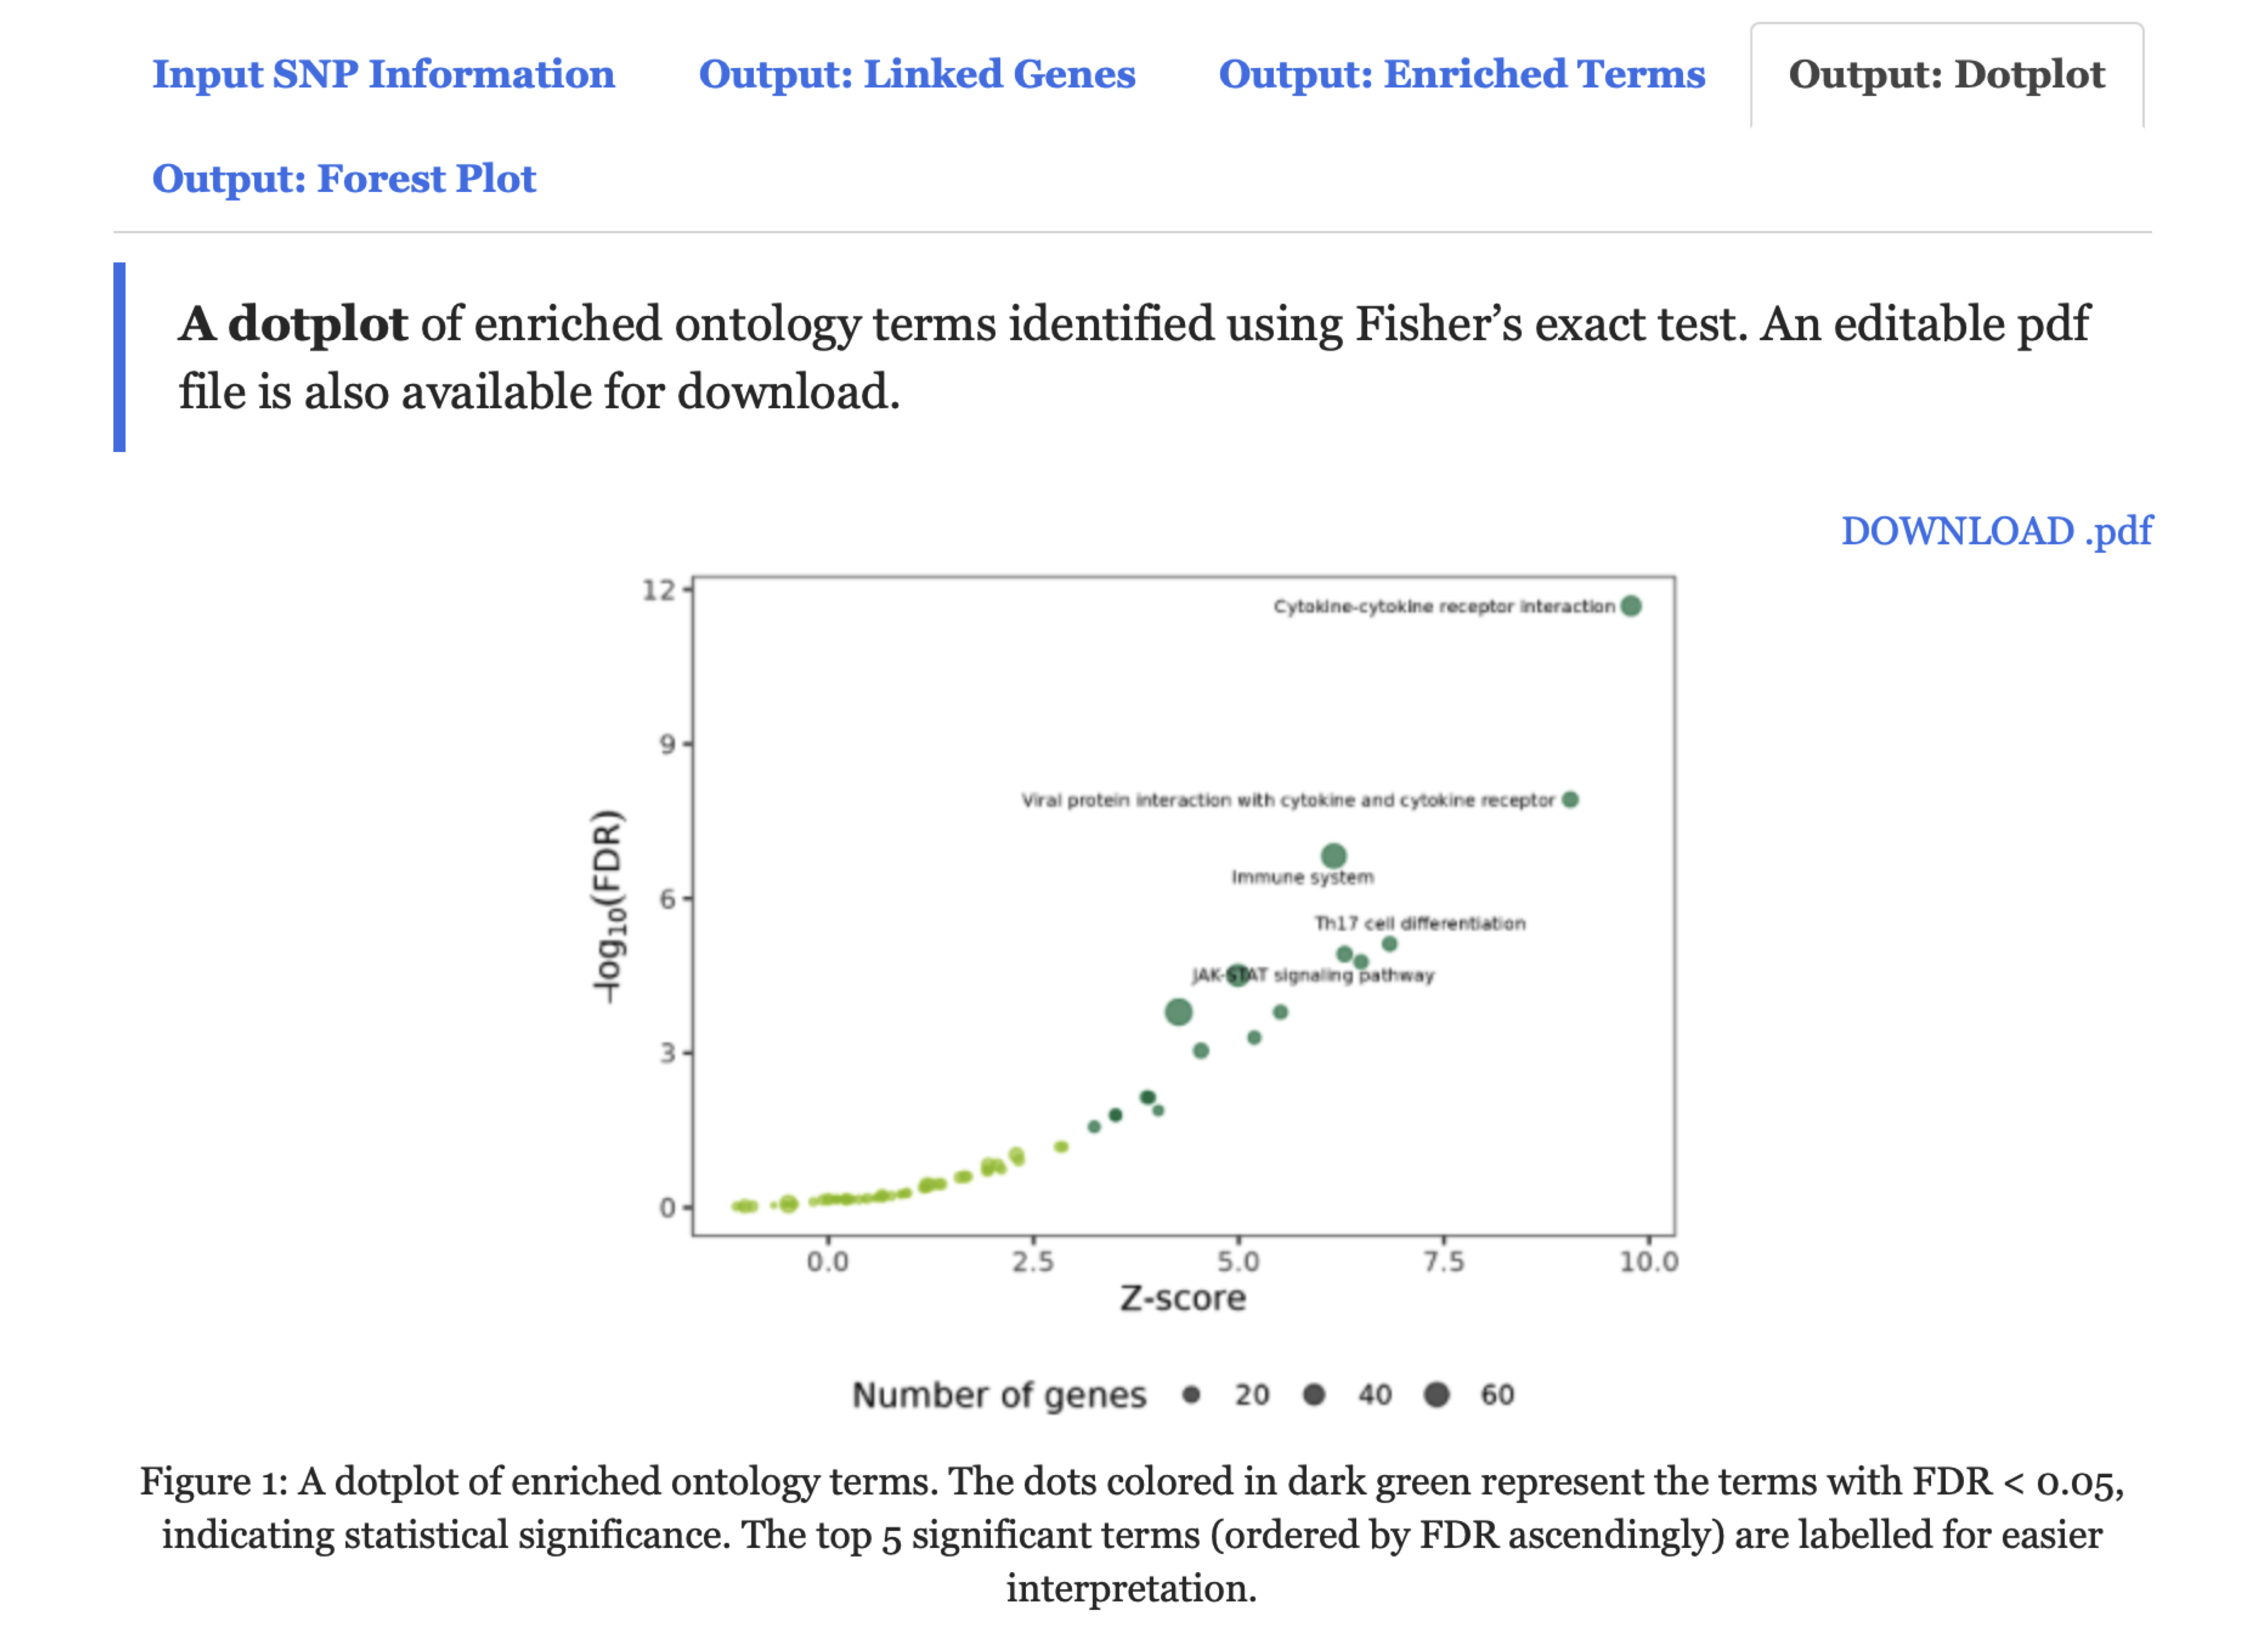
FIGURE 7.5: A dotplot for enriched ontology terms under the Output: Dotplot tab.
- Under the
Output: Forest Plottab,A forest plotillustrates enriched ontology terms. A downloadable pdf file is also provided.
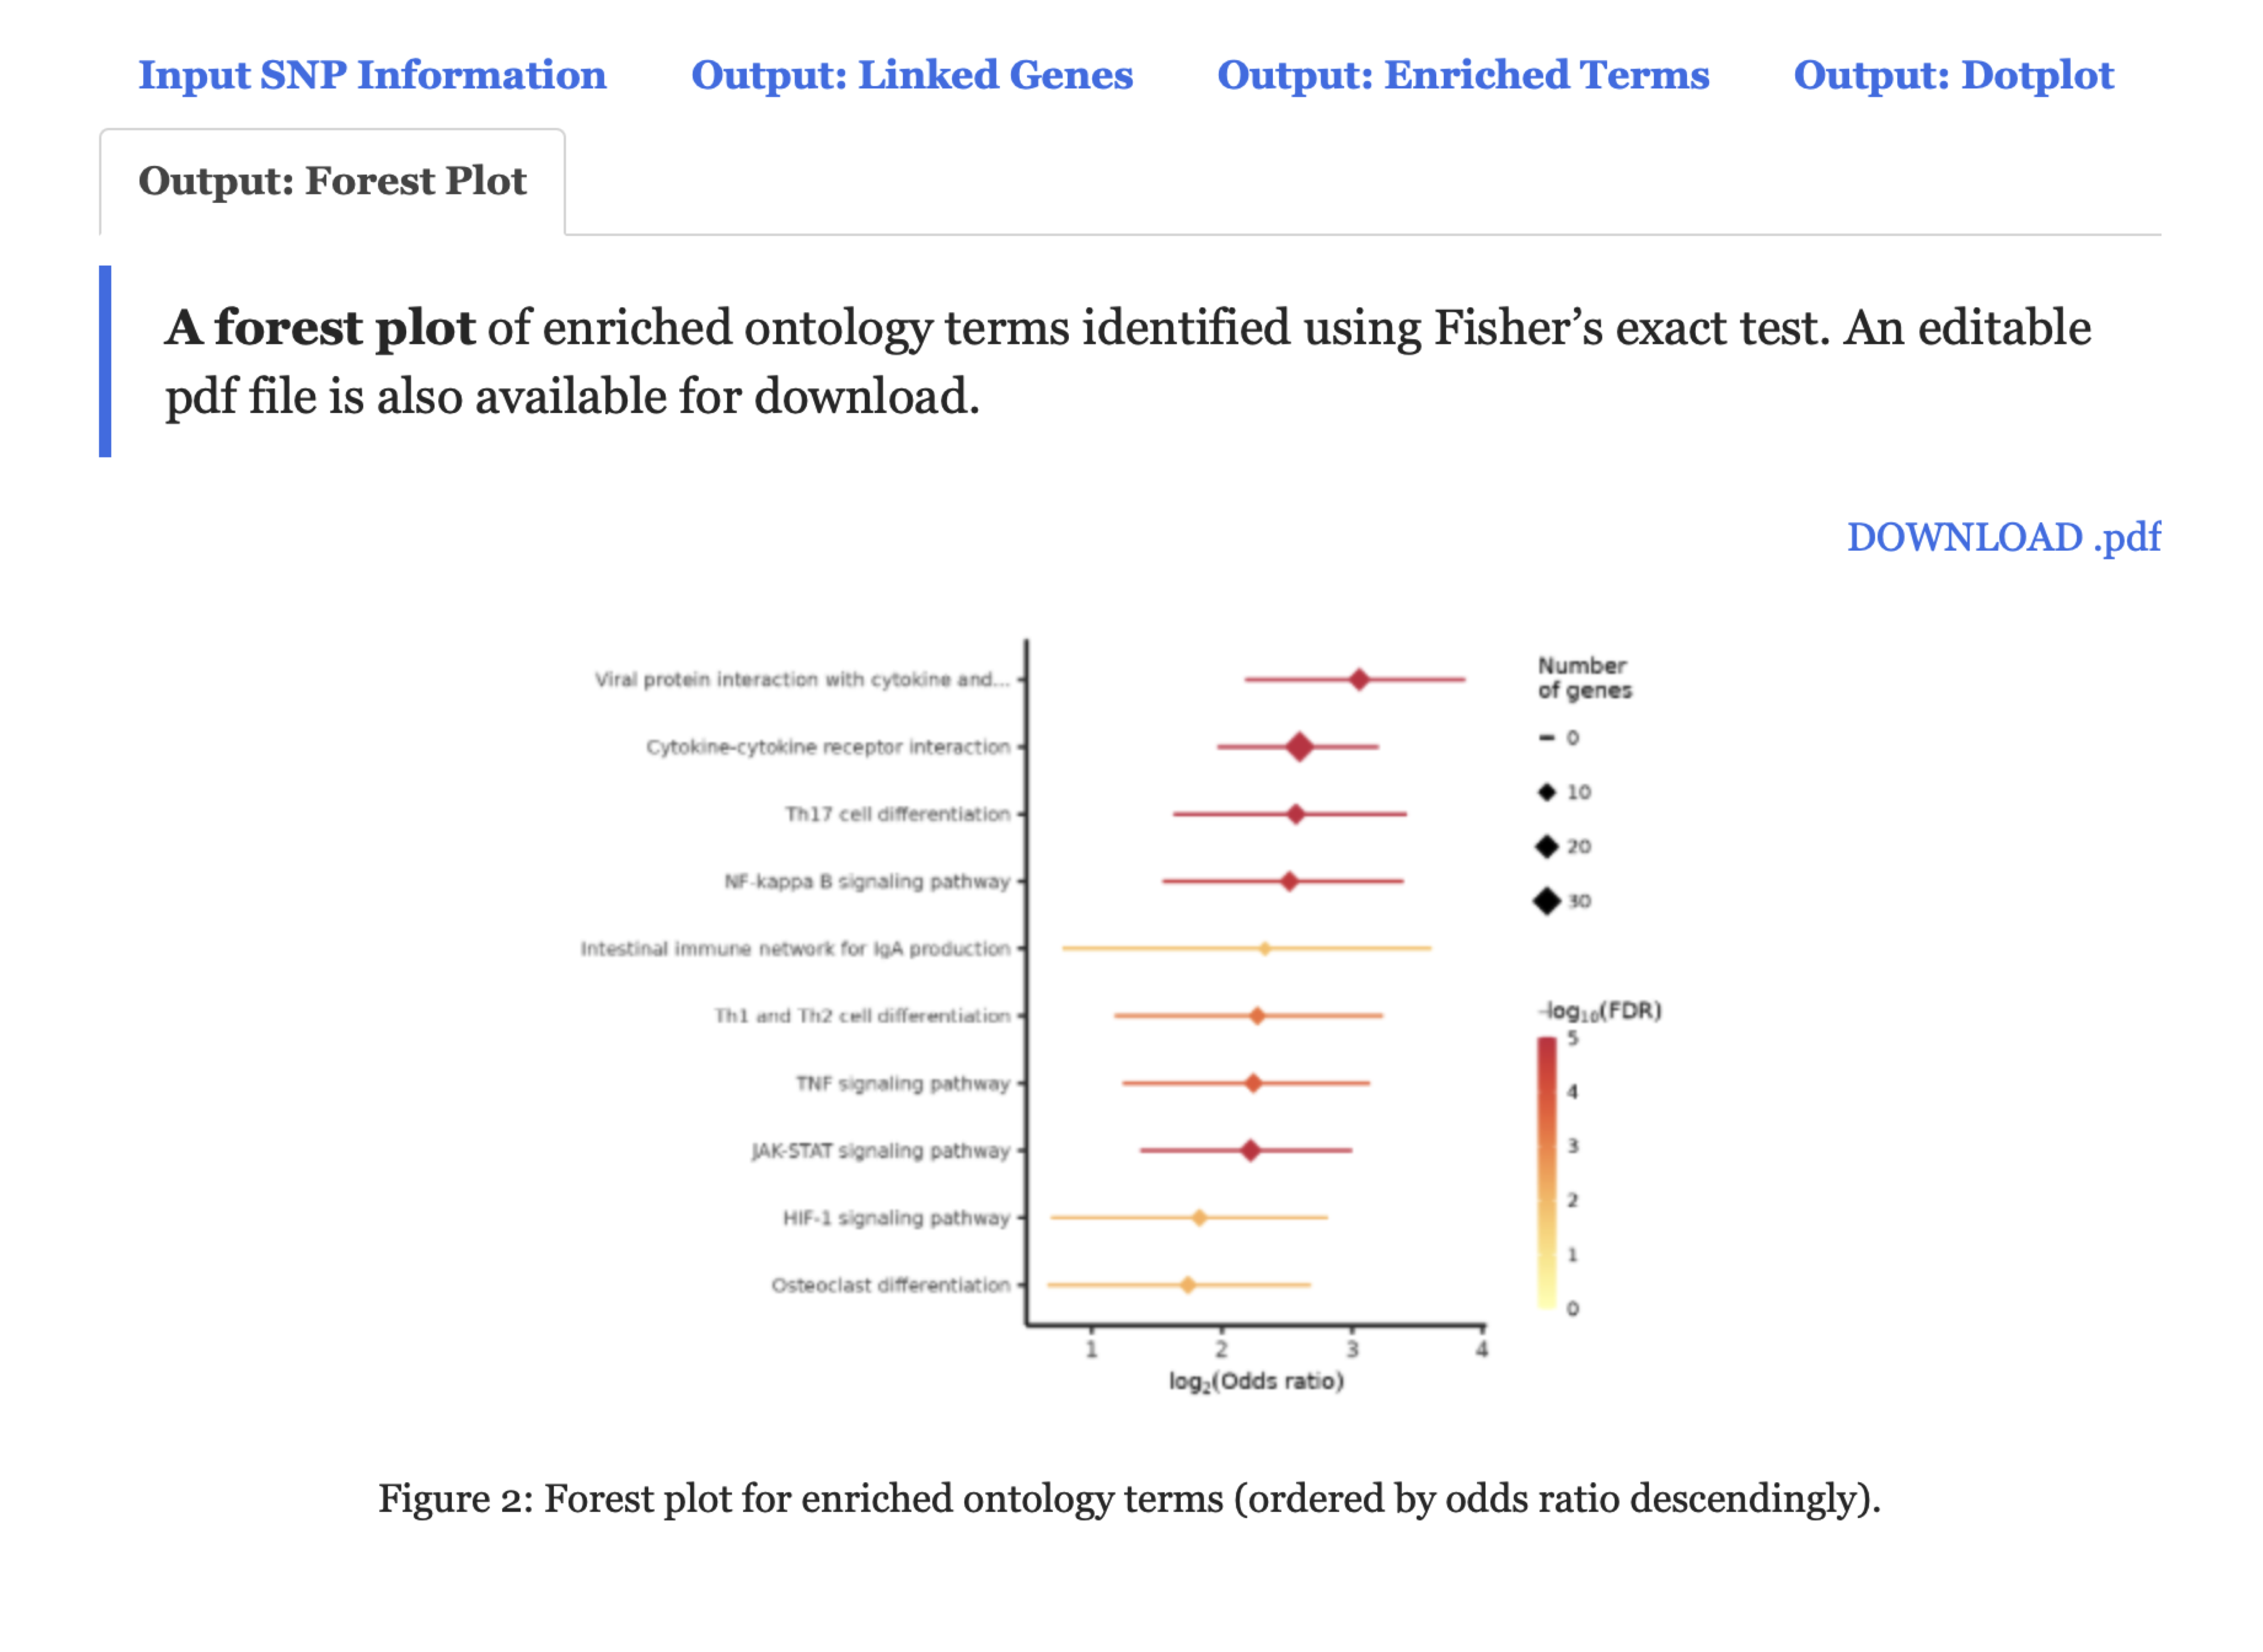
FIGURE 7.6: A forest plot for enriched ontology terms under the Output: Forest Plot tab.