Section 11 SUBNETWORK ANALYSER (REGIONS) - SAR
11.1 Input Interface
Input
Step 1andStep 2: Input a list of genomic regions with two columns. The 1st column contains genomic regions in the format ofchr:start-end, and the 2nd column for the significance information (p-values between 0 and 1).Step 3: Use genomic proximity, enhancer-gene maps, or promoter capture Hi-C to identify linked genes.Step 4andStep 5: A subnetwork of highly-scored genes is identified from a gene network (Step 4), with the desired number of genes in the resulting subnetwork (Step 5). The significance (p-value) of observing the identified subnetwork by chance can also be estimated by a degree-preserving node permutation test.More Controls: Use additional parameters to fine-tune the steps described above.SUBMIT: click the SUBMIT button to execute the analysis.
Output
- Example Output includes interactive tables and high-quality figures for the resulting subnetwork. A summary of input data and the runtime (computed on the server side) is also provided for reference.
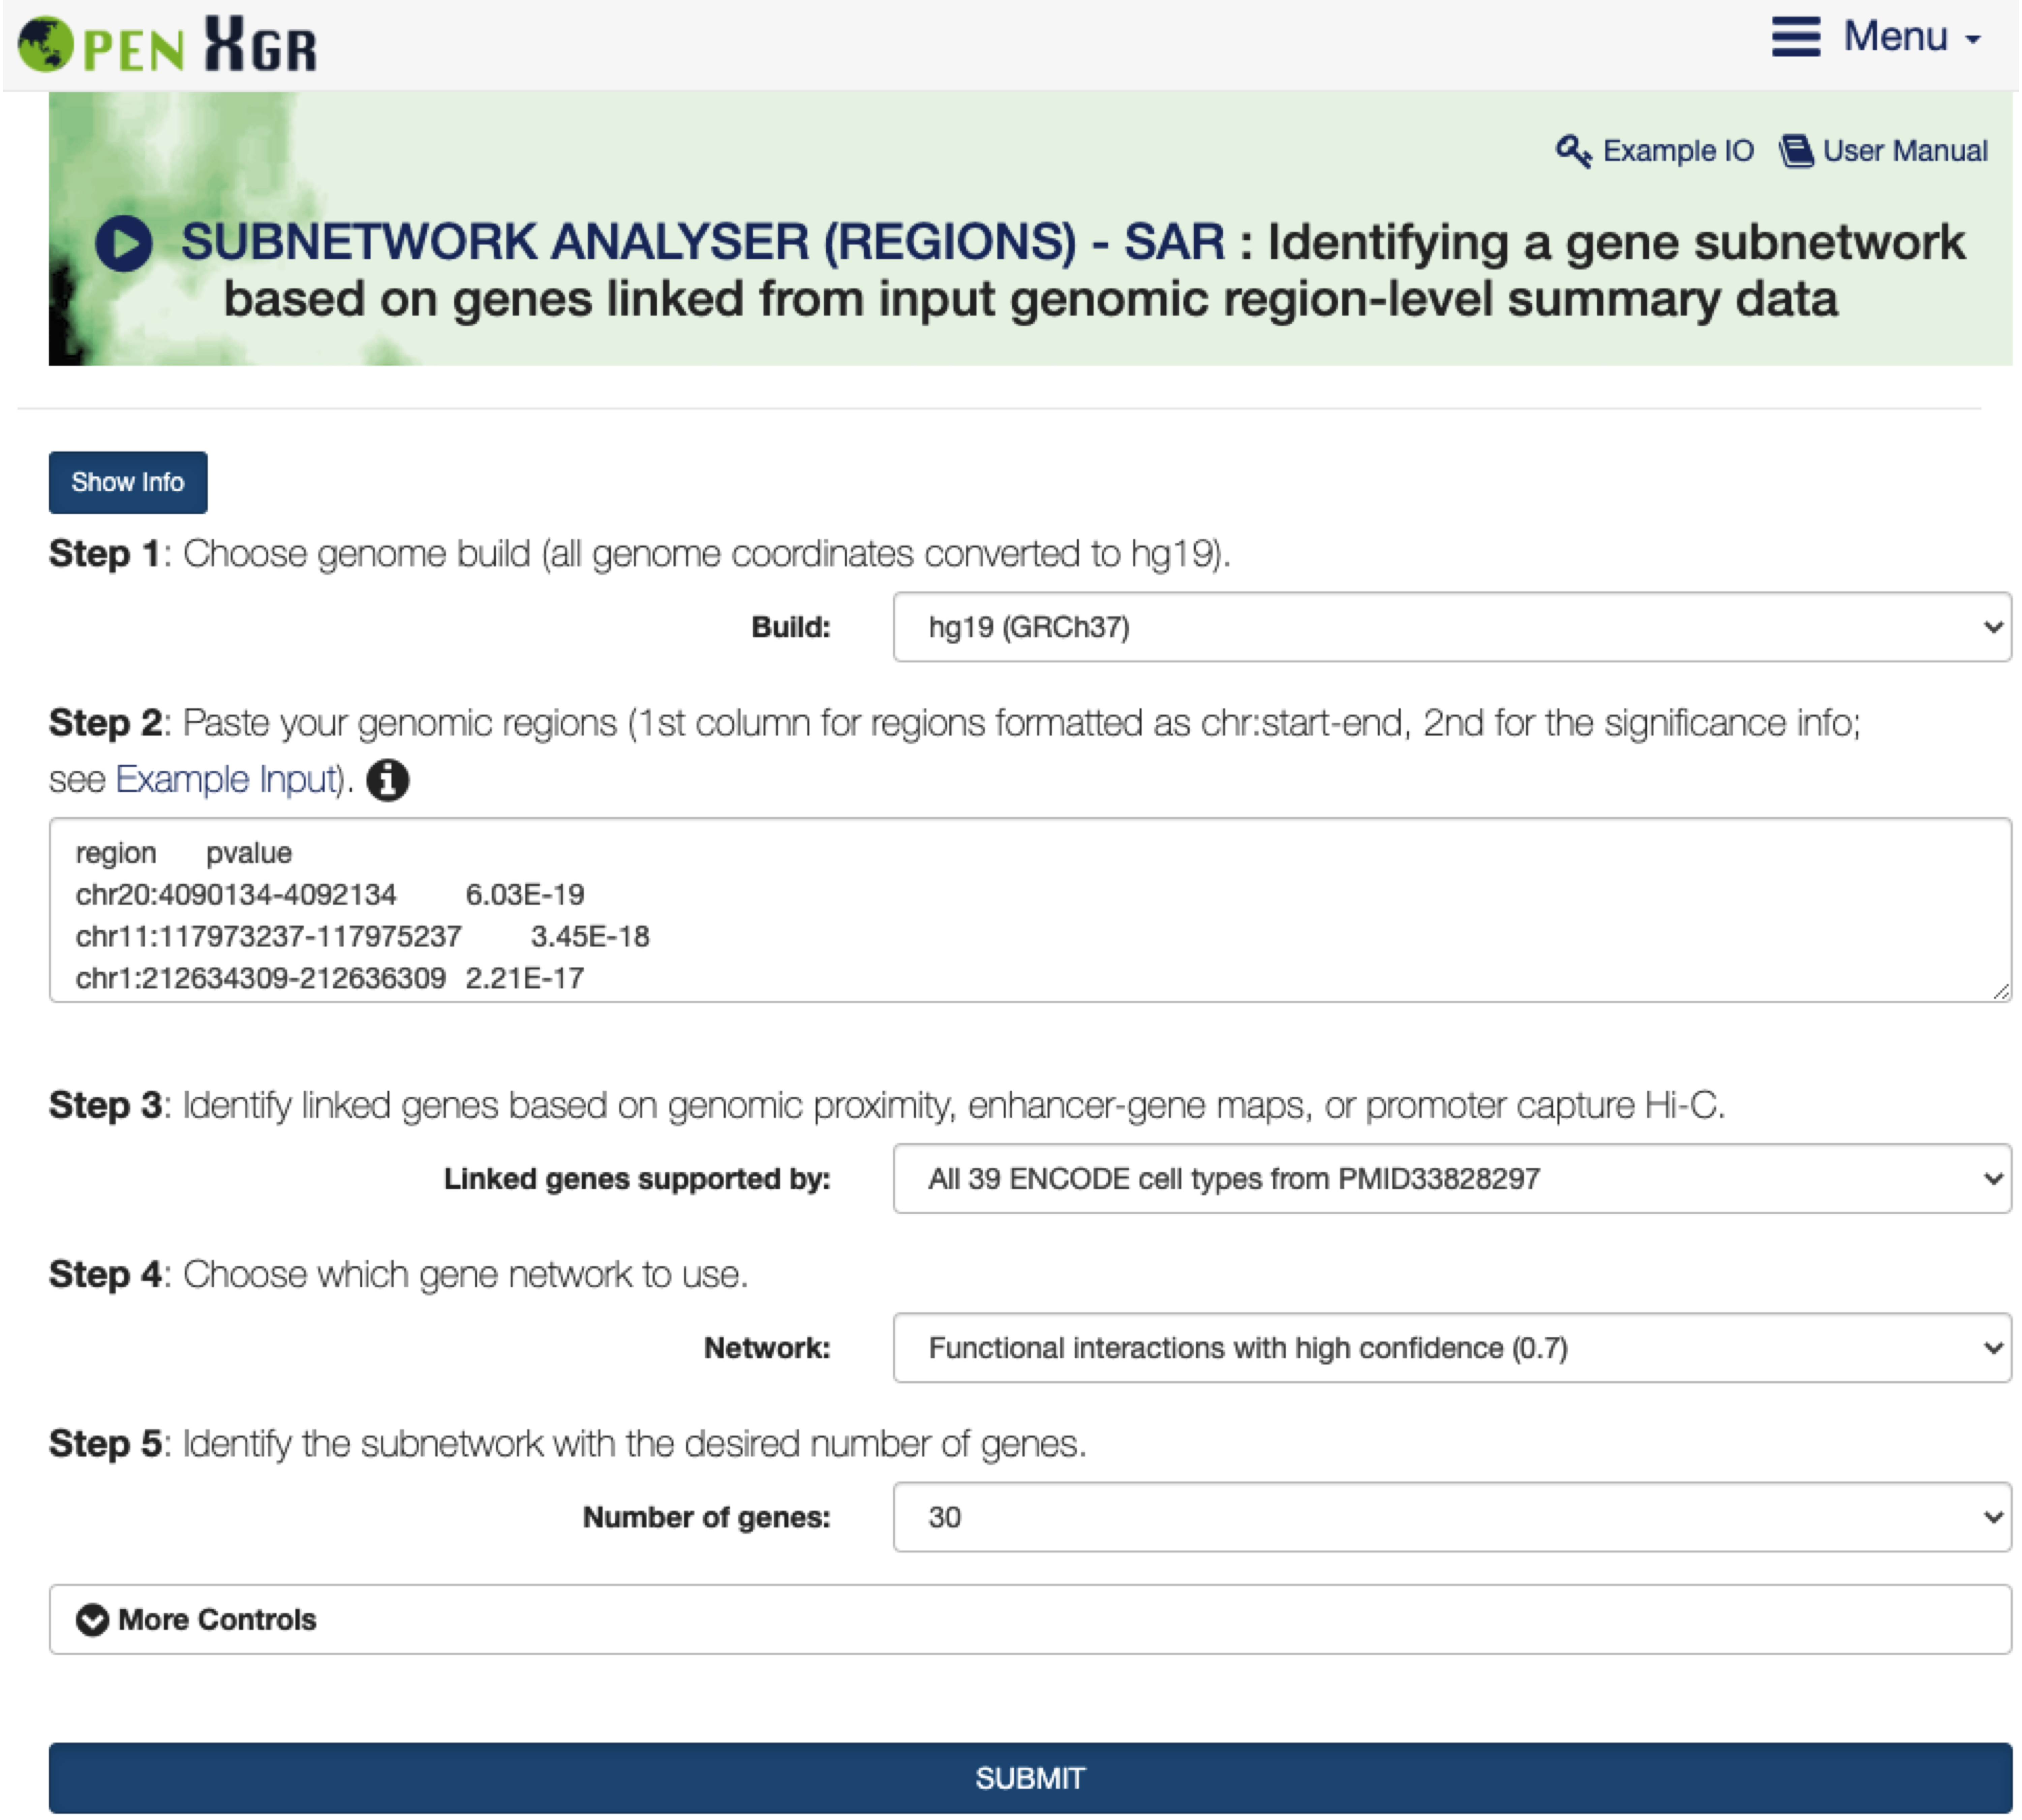
FIGURE 11.1: The interface of SUBNETWORK ANALYSER (REGIONS) - SAR, including the Show/Hide Info toggle button with the help information on how to use the interface.
11.2 Subnetwork Results
- Under the
Input Genomic Region-Level Summary Datatab,An interactive tablelists user-input summary data.
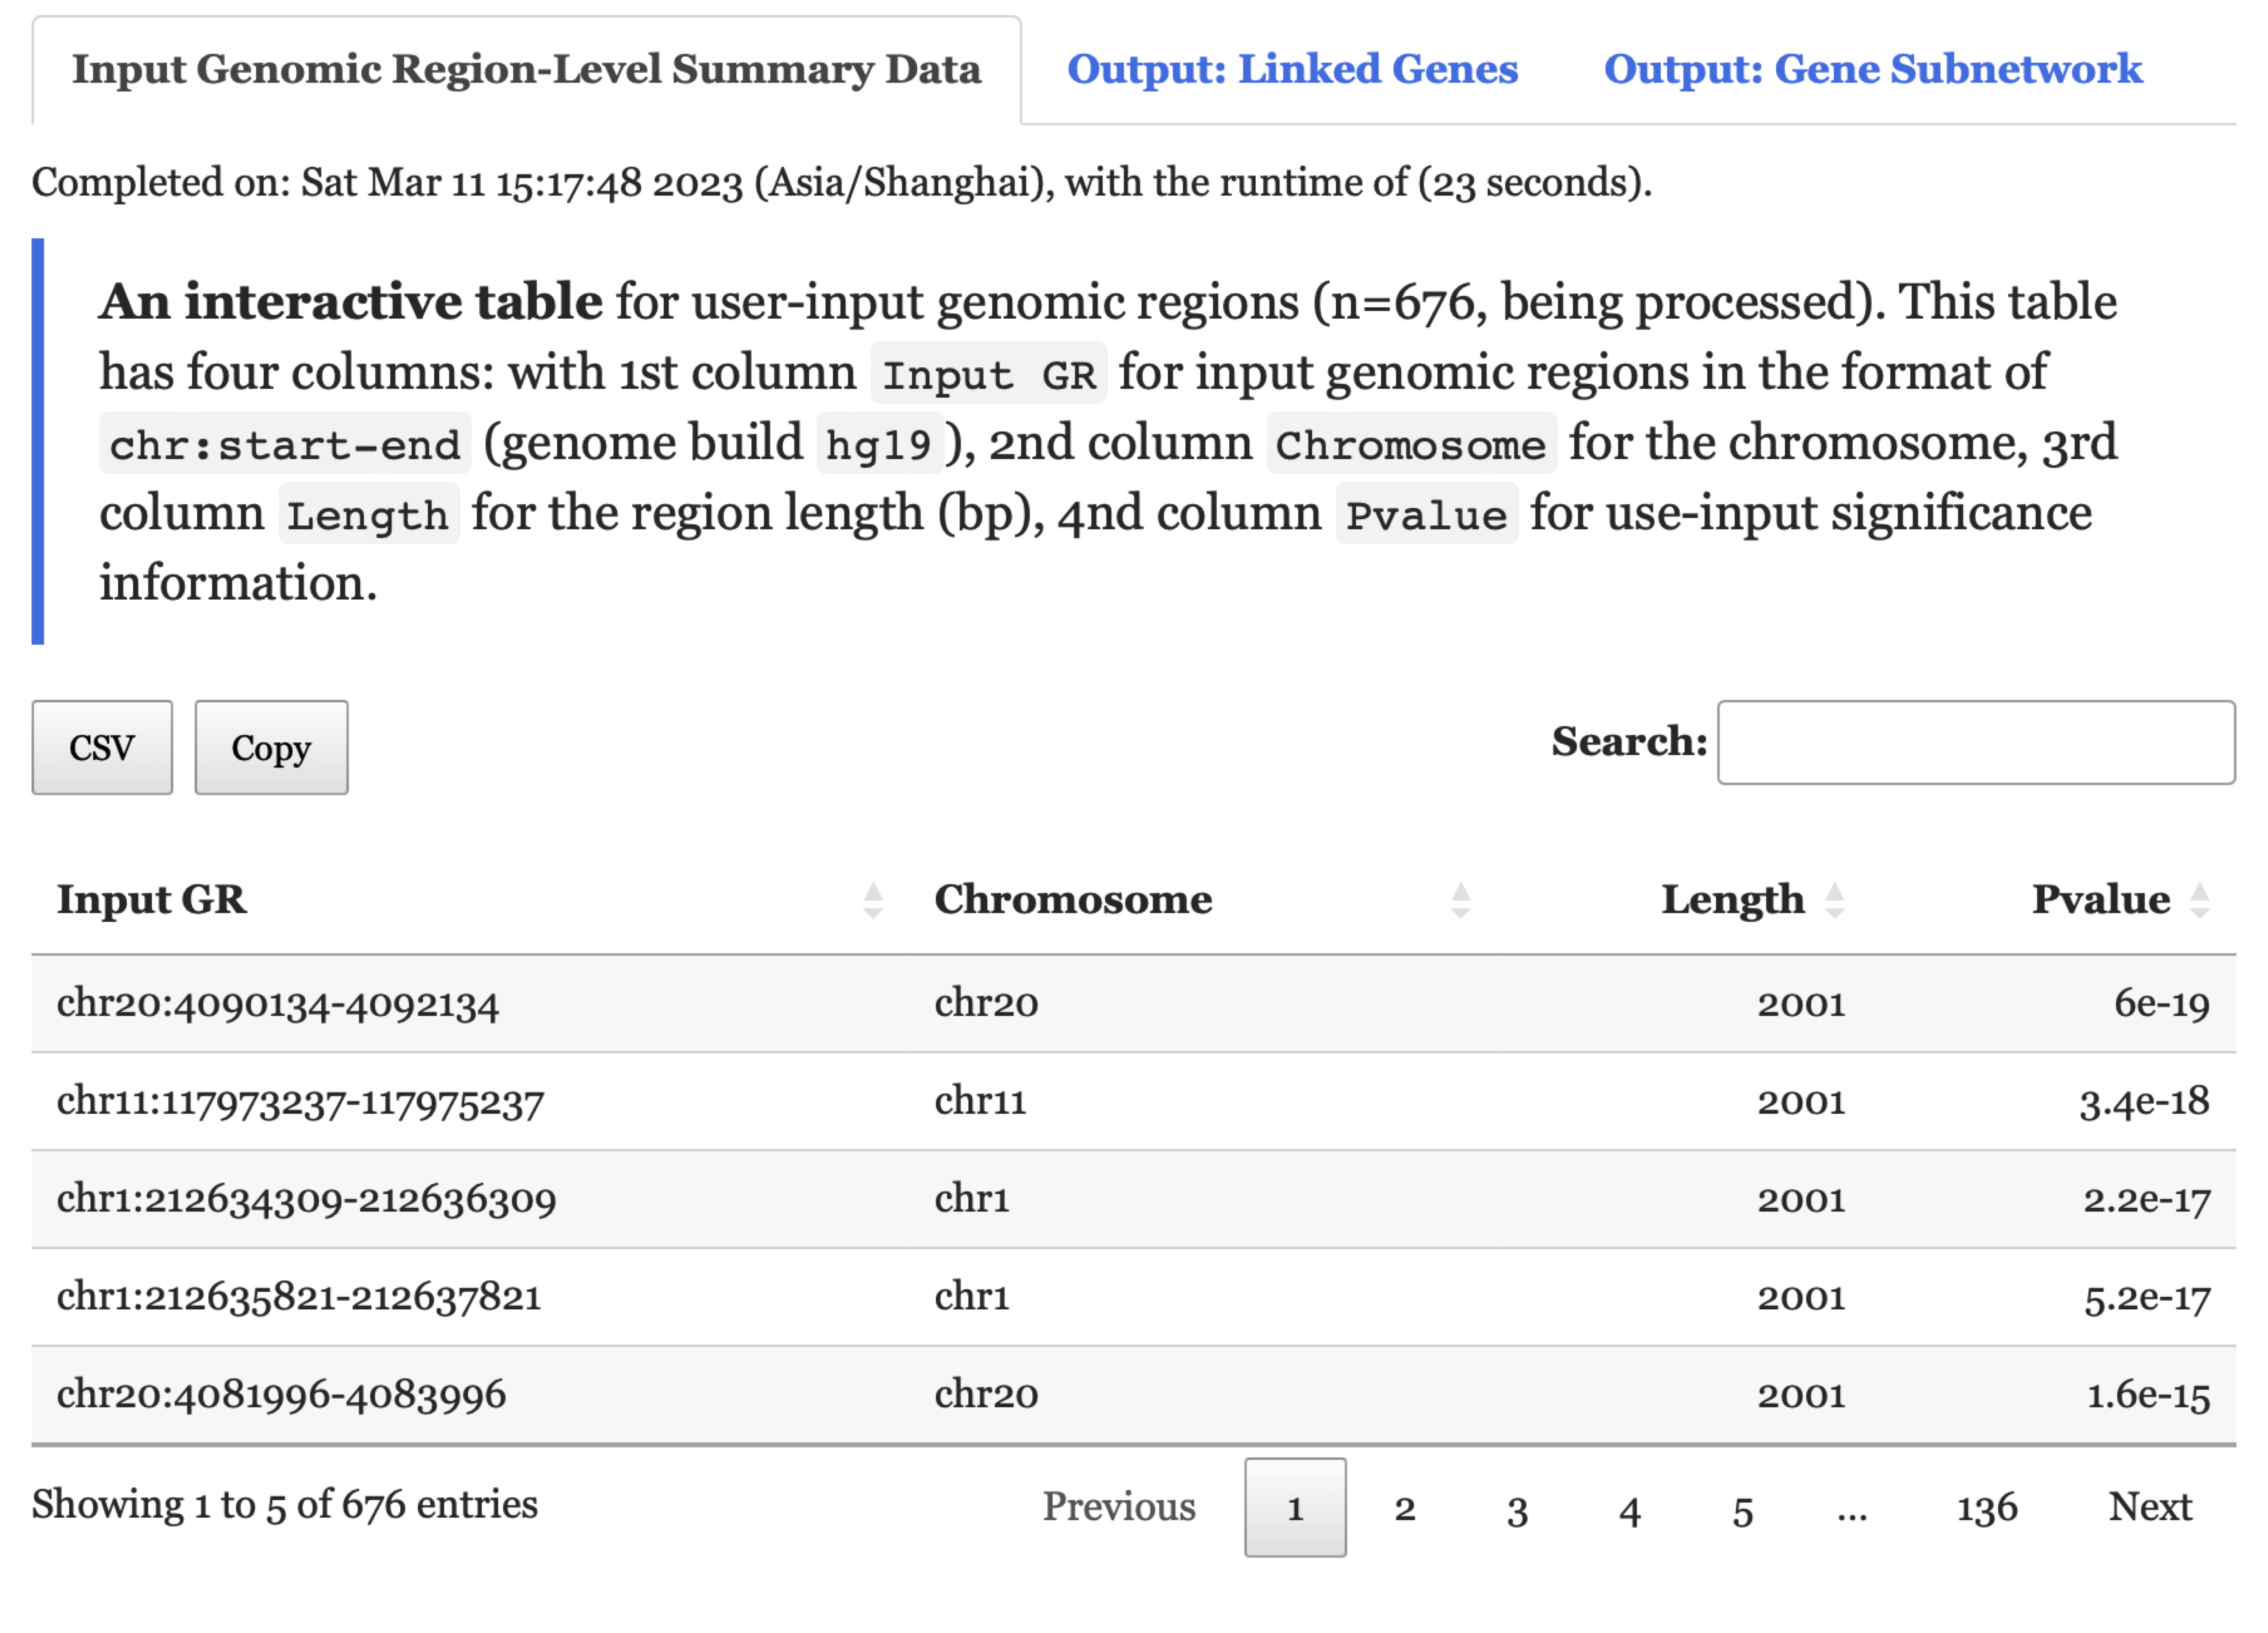
FIGURE 11.2: User-input summary data under the Input Genomic Region-Level Summary Data tab returned for exploration.
- Under the
Output: Linked Genestab,An interactive tablelists genes linked from the input genomic regions.
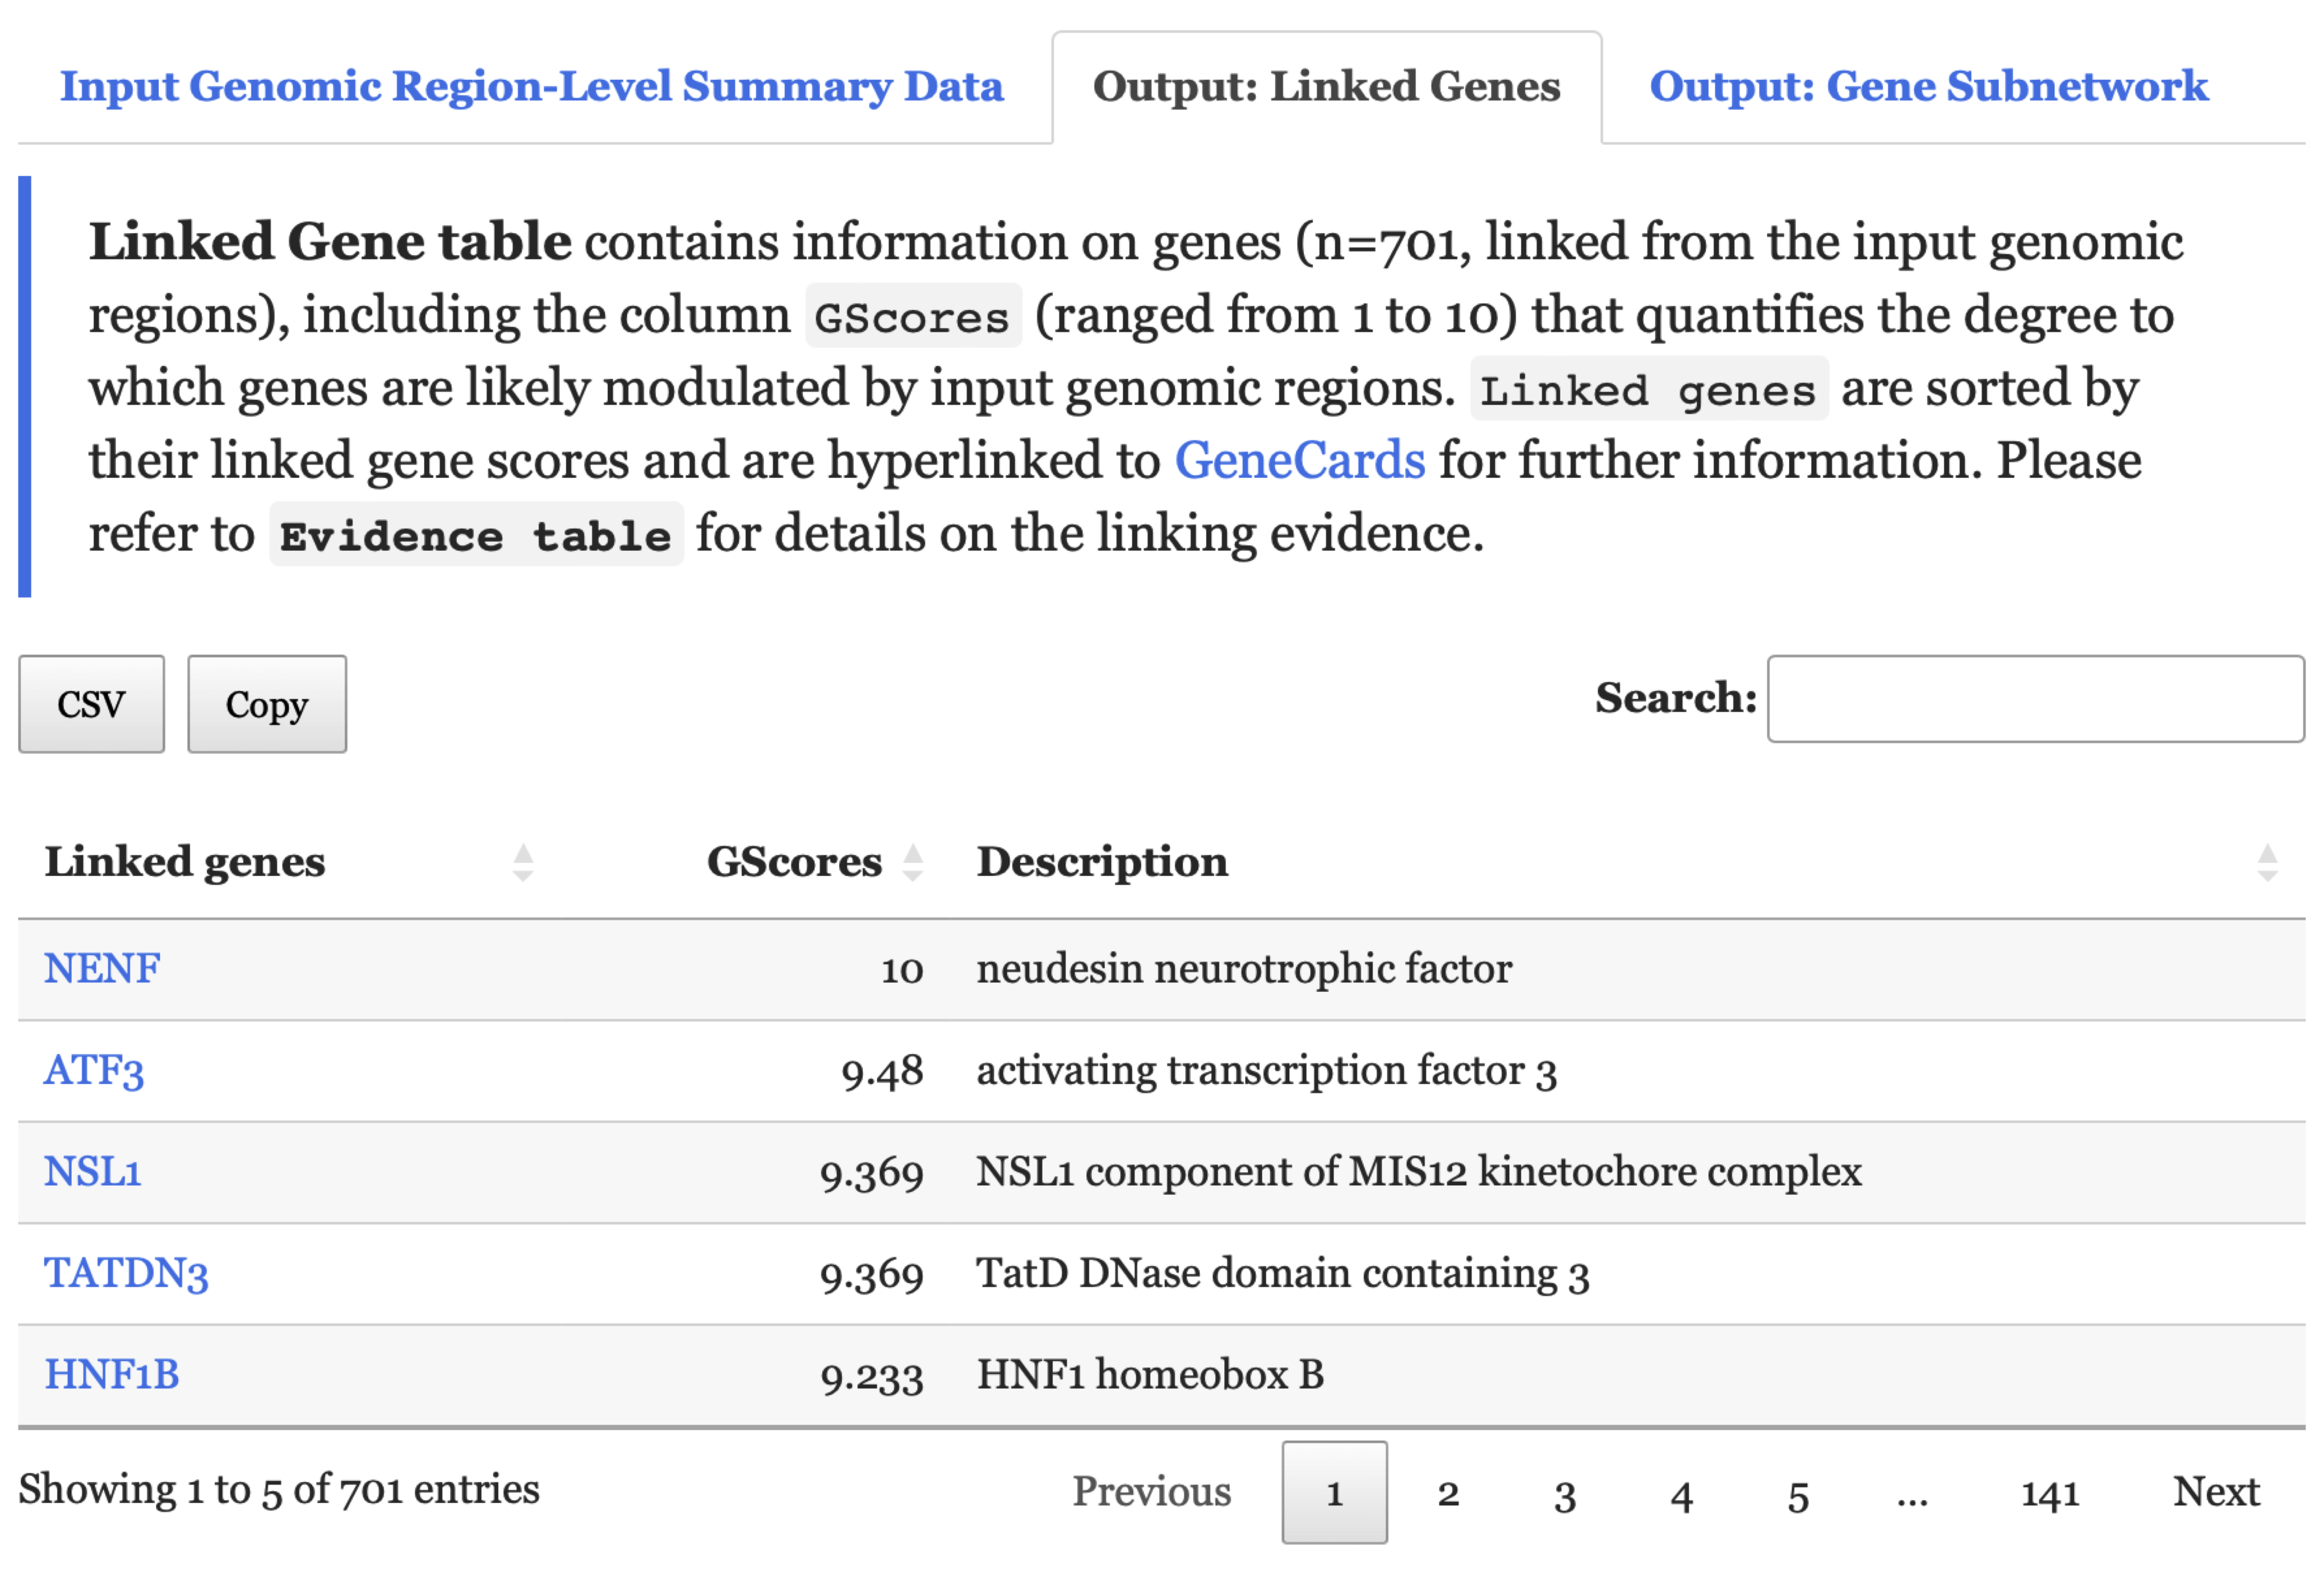
FIGURE 11.3: An interactive table listing genes linked from the input genomic regions under the Output: Linked Genes tab.
- Under the
Output: Gene Subnetworktab,A network visualisationof the identified subnetwork is provided, along withAn interactive tablefor the subnetwork genes.
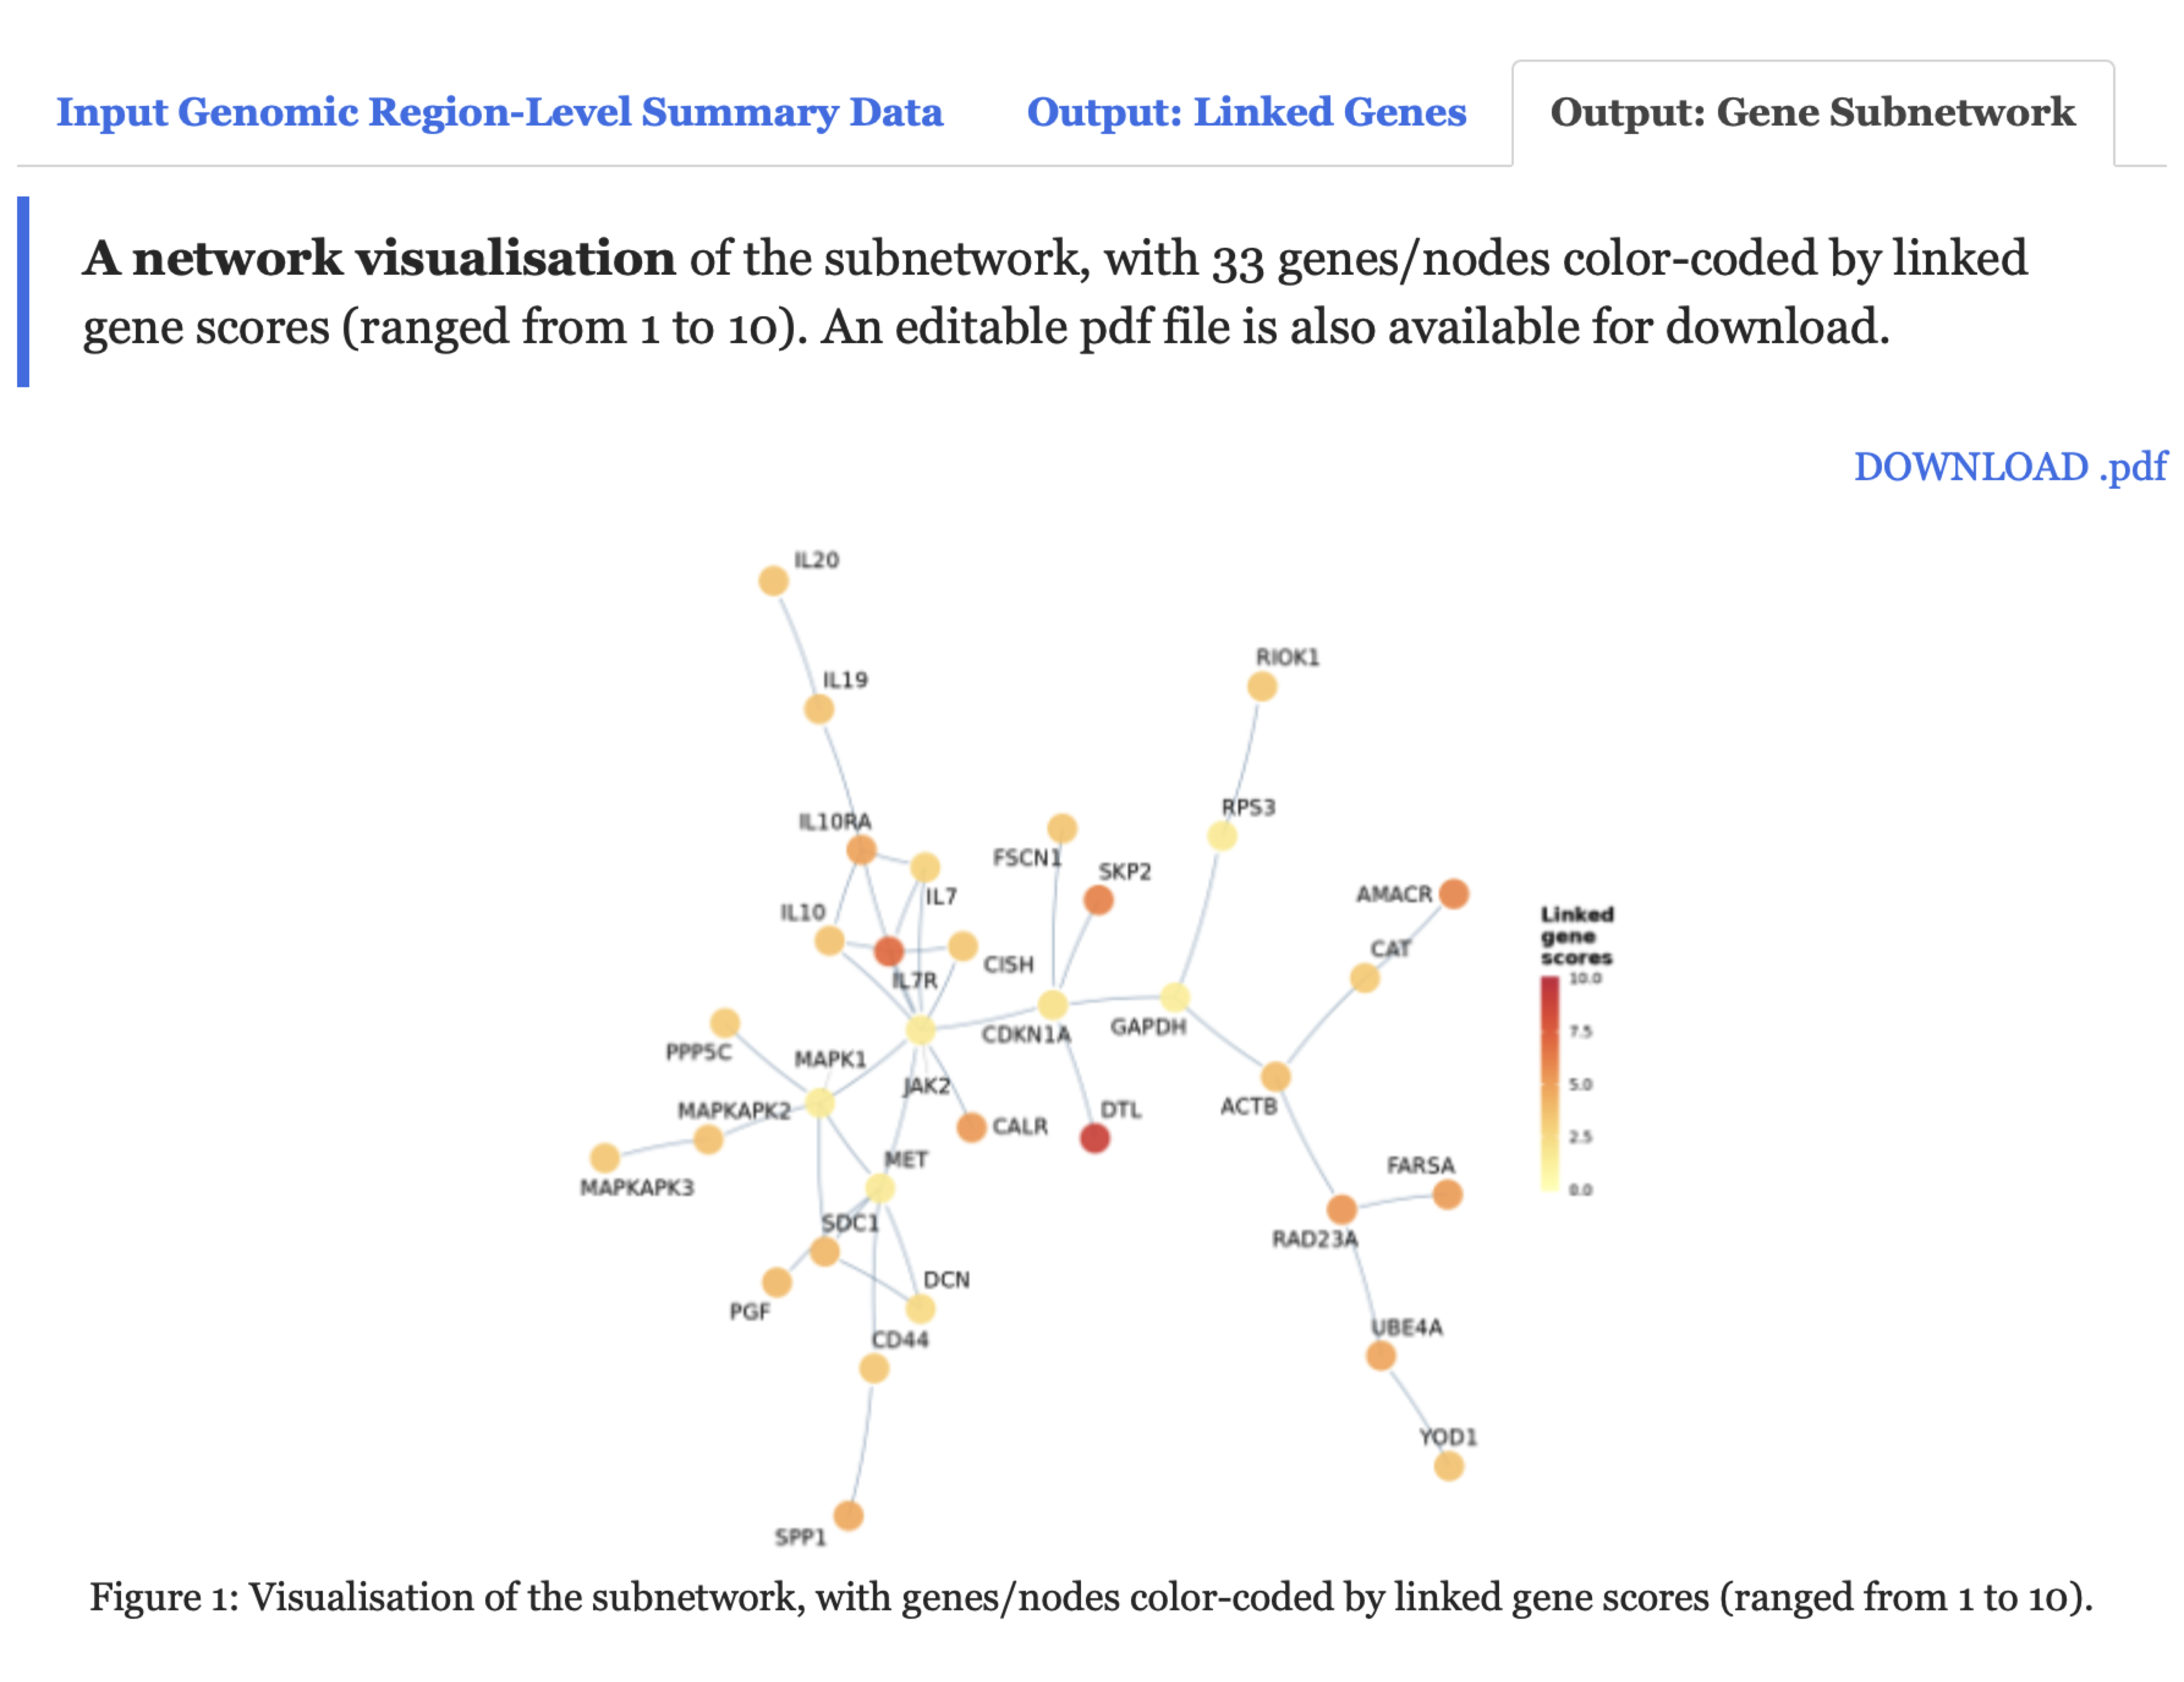
FIGURE 11.4: A network visualisation of the resulting subnetwork under the Output: Gene Subnetwork tab, with genes/nodes color-coded by linked gene scores, which range from 1 to 10.